WALL STREET PREP - FINANCIAL MODELING QUICK LESSON - BUILDING A SIM
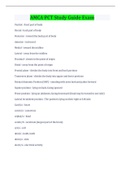
Valuation Date: 1/1/2013
Share Price on Valuation Date: $25.00
Diluted Shares Outstanding 500.0
Select Operating Data
2010A 2011A 2012A 2013P
Revenue $5,300.0 $5,700.0 $6,000.0 $6,600.0
Revenue Growth Rate (%) 10.0%
EBITDA $2,000.0 $2,080.0 $2,150.0 $2,310.0
EBITDA Margin (%) 35.0%
EBIT 1,700.0 1,750.0 1,800.0 $1,980.0
EBIT Margin (%) 30.0%
Depreciation & Amortization $300.0 $330.0 $350.0 $369.6
D&A as a % of revenue 5.6%
Select Balance Sheet And Other Data
2010A 2011A 2012A 2013P
Cash $700.0 $1,000.0 $1,500.0 1,500.0
Accounts Receivable 1,100.0 1,250.0 1,350.0 1,485.0
Inventories 900.0 925.0 935.0 949.0
Prepaid Expenses 50.0 63.0 75.0 89.7
Accounts Payable $930.0 $960.0 $1,000.0 $1,015.0
Accrued Expenses 90.0 88.0 93.0 102.3
Debt 2,300.0 4,750.0 4,250.0 4,250.0
Capital Expenditures 455.0 488.0 535.0 588.5
Accounts Receivable Growth (%) 10.0%
Inventories Growth (%) 1.5%
Prepaid Expenses Growth (%) 19.6%
Accounts Payable Growth (%) 1.5%
Accrued Expenses Growth (%) 10.0%
Capital Expenditures Growth (%) 10.0%
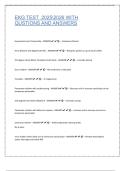
Free Cash Flow Buildup
$mm
, 2010A 2011A 2012A 2013P
Period 1
Total Revenues
EBITDA
EBIT
Tax rate 40.0%
EBIAT
Depreciation & Amortization
Accounts receivable
Inventories
Prepaid expenses
Accounts payable
Accrued expenses
Capital expenditures
Unlevered free cash flows
Discount Rate (WACC)
Present value of free cash flows
Sum of present values of FCFs
Terminal Value
Growth in perpetuity method:
Long term growth rate 4.0%
WACC
Free cash flow (t+1)
Terminal Value
Present Value of Terminal Value
WACC
Share Price
Diluted Shares Outstanding
Cost of Debt 5.2%
Tax Rate 40.0%
After-tax Cost of Debt
Cost of Equity 15.0%
Total Debt ($)
Total Equity ($)
Total Capital
Debt Weighting
Equity Weighting
WACC =
Enterprise Value to Equity Value
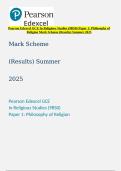
Valuation Date: 1/1/2013
Share Price on Valuation Date: $25.00
Diluted Shares Outstanding 500.0
Select Operating Data
2010A 2011A 2012A 2013P
Revenue $5,300.0 $5,700.0 $6,000.0 $6,600.0
Revenue Growth Rate (%) 10.0%
EBITDA $2,000.0 $2,080.0 $2,150.0 $2,310.0
EBITDA Margin (%) 35.0%
EBIT 1,700.0 1,750.0 1,800.0 $1,980.0
EBIT Margin (%) 30.0%
Depreciation & Amortization $300.0 $330.0 $350.0 $369.6
D&A as a % of revenue 5.6%
Select Balance Sheet And Other Data
2010A 2011A 2012A 2013P
Cash $700.0 $1,000.0 $1,500.0 1,500.0
Accounts Receivable 1,100.0 1,250.0 1,350.0 1,485.0
Inventories 900.0 925.0 935.0 949.0
Prepaid Expenses 50.0 63.0 75.0 89.7
Accounts Payable $930.0 $960.0 $1,000.0 $1,015.0
Accrued Expenses 90.0 88.0 93.0 102.3
Debt 2,300.0 4,750.0 4,250.0 4,250.0
Capital Expenditures 455.0 488.0 535.0 588.5
Accounts Receivable Growth (%) 10.0%
Inventories Growth (%) 1.5%
Prepaid Expenses Growth (%) 19.6%
Accounts Payable Growth (%) 1.5%
Accrued Expenses Growth (%) 10.0%
Capital Expenditures Growth (%) 10.0%
Free Cash Flow Buildup
$mm
, 2010A 2011A 2012A 2013P
Period 1
Total Revenues
EBITDA
EBIT
Tax rate 40.0%
EBIAT
Depreciation & Amortization
Accounts receivable
Inventories
Prepaid expenses
Accounts payable
Accrued expenses
Capital expenditures
Unlevered free cash flows
Discount Rate (WACC)
Present value of free cash flows
Sum of present values of FCFs
Terminal Value
Growth in perpetuity method:
Long term growth rate 4.0%
WACC
Free cash flow (t+1)
Terminal Value
Present Value of Terminal Value
WACC
Share Price
Diluted Shares Outstanding
Cost of Debt 5.2%
Tax Rate 40.0%
After-tax Cost of Debt
Cost of Equity 15.0%
Total Debt ($)
Total Equity ($)
Total Capital
Debt Weighting
Equity Weighting
WACC =
Enterprise Value to Equity Value