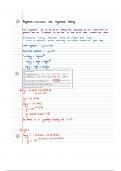
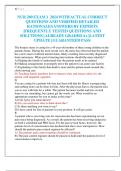
Regression correlation and Hypothesis testing
The regression bit is the act of setting the parameters of our model here the
gradient and the Y intercept of the line of best fit to best explain the data
Extrapolation making predictions outside the original data range
this is unreliable as the trendmay not continue outside the given range
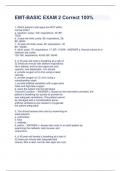
Linear regression a be
y
Exponential regression ab
y
logy logab
logy logatlogb
logy logatoclogb
O
a 0.2215 0.07920C
y E O X
0.2215
y
109g
0.2215
0.2215
10
g
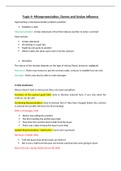
0.60 12dp 70
9
Sothere is a
growing colony at
E O
bl girl
109g 0.2215 0.0792 t
0.2215 0.0792
10
g
, g
t
0792
100
0.2215
10 go.org
g
0.6 1.2
9
K OG 6 1.2
2 0.32
yP 2 0.34
log
0.3 E
P 102 3 E
P 102 100
P 100 1.995
K 100 6 1.995
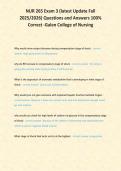
Hypothesis testing for correlation
r is the PMC of a sample
P is the PMCC of the whole population
no
null hypothesis will always be
Ho p o
data sheet we get our
Hy p o using valve
significant
Sample size 10 O 4428
r 0.21
The regression bit is the act of setting the parameters of our model here the
gradient and the Y intercept of the line of best fit to best explain the data
Extrapolation making predictions outside the original data range
this is unreliable as the trendmay not continue outside the given range
Linear regression a be
y
Exponential regression ab
y
logy logab
logy logatlogb
logy logatoclogb
O
a 0.2215 0.07920C
y E O X
0.2215
y
109g
0.2215
0.2215
10
g
0.60 12dp 70
9
Sothere is a
growing colony at
E O
bl girl
109g 0.2215 0.0792 t
0.2215 0.0792
10
g
, g
t
0792
100
0.2215
10 go.org
g
0.6 1.2
9
K OG 6 1.2
2 0.32
yP 2 0.34
log
0.3 E
P 102 3 E
P 102 100
P 100 1.995
K 100 6 1.995
Hypothesis testing for correlation
r is the PMC of a sample
P is the PMCC of the whole population
no
null hypothesis will always be
Ho p o
data sheet we get our
Hy p o using valve
significant
Sample size 10 O 4428
r 0.21