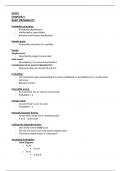
Psychology research methods: Statistical tests
The sign test: The critical value is found using
1. Test of difference -Significance level
2. Repeated measures design -Number of participants (N or df)
3. Nominal data (in categories) -Whether the hyp is directional (one-tailed) or non-
direction (two-tailed)
-Calculated value = or < (less than) critical value
-For calculated value (S), record sign of difference for each
Wilcoxon: Non-parametric test
participant (if score decreased, + sign), add up pluses & minuses
1. Test of difference
and take the less frequent sign as S, then compare S with the
2. Repeated measures design
critical value if lower than significant (reject null)
3. Ordinal data (subjective scale)
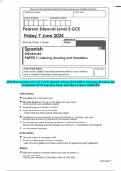
Mann-Whitney: Non-parametric test -Calculated value = or < (less than) critical value
1. Test of difference -For calculated value (T), calculate a different
2. Independent groups design between scores in each condition, rank the
3. Ordinal data (subjective scale) differences (if 0 difference no ranking and deduced
from N value), find less frequent sign, and find the
-Calculated value = or < (less than) critical value sum of the ranks
-For calculated value (U), rank data number from 1 (if same no
then add and get a mean), calculate the sum of ranks for 2 groups,
calculate the smaller value of U. Use equation: Parametric tests
-Participants are drawn from a normally distributed
population
-There is homogeneity of variance as SD in both groups
are similar
Unrelated t-test: Parametric test
1. Test of difference Related t-test: Parametric test
2. Independent groups design 1. Test of difference
3. Interval data 2. Repeated measures design
3. Interval data
-Calculated value = or > (greater than) critical value
-For calculated value (t), sum of scores calculated for A & B -Calculated value = or > (greater than) critical value
groups, square each value in group A and calculate sum of all -For calculated value (t), calculate the dif in scores in
squared (same for B), use equation: two conditions, square each difference, find sum of
difference and sum of squares, use equation:
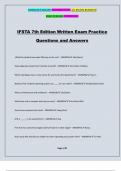
Spearman’s rho: Test of correlation Pearson’s r: Test of correlation Chi-squared: Test of correlation
1. Test of association/correlation 1. Test of 1. Test of difference or
2. Any design association/correlation association
3. Ordinal data 2. Any design 2. Independent groups design
3. Interval data 3. Nominal data
-Calculated value = or > (greater than)
critical value -Calculated value = or > (greater -Calculated value = or > (greater than)
-For calculated value (rho), rank each than) critical value critical value
set of scores separately from lowest to -For calculated value (r), calculate -For calculated value (x^2), 2x2
highest, find dif between each pair of sum of scores for x and y, square contingency table, find totals for each
ranks, square the difference, add up each x and y and calculate the sum, row, column and overall, calculate
the squared differences, use equation: multiply x and y for each p (add expected frequencies for each cell
these together), use equation: (total for row X total by column/ total)
The sign test: The critical value is found using
1. Test of difference -Significance level
2. Repeated measures design -Number of participants (N or df)
3. Nominal data (in categories) -Whether the hyp is directional (one-tailed) or non-
direction (two-tailed)
-Calculated value = or < (less than) critical value
-For calculated value (S), record sign of difference for each
Wilcoxon: Non-parametric test
participant (if score decreased, + sign), add up pluses & minuses
1. Test of difference
and take the less frequent sign as S, then compare S with the
2. Repeated measures design
critical value if lower than significant (reject null)
3. Ordinal data (subjective scale)
Mann-Whitney: Non-parametric test -Calculated value = or < (less than) critical value
1. Test of difference -For calculated value (T), calculate a different
2. Independent groups design between scores in each condition, rank the
3. Ordinal data (subjective scale) differences (if 0 difference no ranking and deduced
from N value), find less frequent sign, and find the
-Calculated value = or < (less than) critical value sum of the ranks
-For calculated value (U), rank data number from 1 (if same no
then add and get a mean), calculate the sum of ranks for 2 groups,
calculate the smaller value of U. Use equation: Parametric tests
-Participants are drawn from a normally distributed
population
-There is homogeneity of variance as SD in both groups
are similar
Unrelated t-test: Parametric test
1. Test of difference Related t-test: Parametric test
2. Independent groups design 1. Test of difference
3. Interval data 2. Repeated measures design
3. Interval data
-Calculated value = or > (greater than) critical value
-For calculated value (t), sum of scores calculated for A & B -Calculated value = or > (greater than) critical value
groups, square each value in group A and calculate sum of all -For calculated value (t), calculate the dif in scores in
squared (same for B), use equation: two conditions, square each difference, find sum of
difference and sum of squares, use equation:
Spearman’s rho: Test of correlation Pearson’s r: Test of correlation Chi-squared: Test of correlation
1. Test of association/correlation 1. Test of 1. Test of difference or
2. Any design association/correlation association
3. Ordinal data 2. Any design 2. Independent groups design
3. Interval data 3. Nominal data
-Calculated value = or > (greater than)
critical value -Calculated value = or > (greater -Calculated value = or > (greater than)
-For calculated value (rho), rank each than) critical value critical value
set of scores separately from lowest to -For calculated value (r), calculate -For calculated value (x^2), 2x2
highest, find dif between each pair of sum of scores for x and y, square contingency table, find totals for each
ranks, square the difference, add up each x and y and calculate the sum, row, column and overall, calculate
the squared differences, use equation: multiply x and y for each p (add expected frequencies for each cell
these together), use equation: (total for row X total by column/ total)