Statistics and Probability Questions & Answers
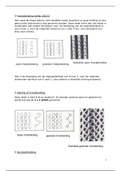
Statistics and Probability Questions & Answers As likely as not - ANSWER: 50% Bar Graph - ANSWER: a graphical representation to organize data that uses solid bars that do not touch each other to show the frequency (number of times) that each category occurs Biased Sample - ANSWER: is NOT representative of a population. One or more parts of the population are favored over others. Box and Whisker Plot - ANSWER: A measure of variability that uses the median to graph data Box plot (box & whisker plot) - ANSWER: a graphical representation showing the five-number summary of data (minimum, lower quartile, median, upper quartile, maximum) Categorical Data - ANSWER: data that represents the attributes of a group of people, events, or objects Certain - ANSWER: 100% Circle Graph - ANSWER: a circular graph with partitions (sections) that represent a part of the total Compound Event - ANSWER: consists of two or more successive outcomes. The probability of a two or more outcomes occurring is the ratio of the number of favorable outcomes to the number of possible outcomes. Dependent Event - ANSWER: If the occurrence of one event DOES affect the likelihood that the other event will occur Dot Plot - ANSWER: a graphical representation to organize small sets of data that uses dots (or Xs) to show the frequency (number of times) that each number occurs Event - ANSWER: A collection of one or more outcomes Experimental Probability - ANSWER: likelihood of possible outcomes based on repeated trials of an experiment Frequency - ANSWER: the number of times the data value occurs Impossible - ANSWER: 0% Independent Event - ANSWER: If the occurrence of one event DOES NOT affect the likelihood that the other events will occur. Interquartile Range - ANSWER: The range of the middle 50% of the data Likely - ANSWER: 75% MAD - ANSWER: Mean Absolute Deviation
Geschreven voor
- Instelling
- Introduction to Statistics
- Vak
- Introduction to Statistics
Documentinformatie
- Geüpload op
- 20 juni 2024
- Aantal pagina's
- 3
- Geschreven in
- 2023/2024
- Type
- Tentamen (uitwerkingen)
- Bevat
- Vragen en antwoorden
Onderwerpen
-
statistics and probability
Ook beschikbaar in voordeelbundel