Unit 7a - analysing the strategic position of a business
Business Missions & Corporate Objectives -
What factors influence the overall mission of a business?
- Culture
- Ethos & values
- Views of shareholders
- The value of stakeholders
What factors influence corporate objectives of a business?
- Short-termism → managers may seek short-term profit at the expense of
long-term investment in R&D
- Business ownership → owners in private sectors are likely to put emphasis on
profit maximisation / public sectors will put emphasis on providing for a societal
need
- Internal business environment
- External business environment
Missions, Corporate Objectives & Strategy -
Strategy → long term plans (difficult to reverse once implemented) → influences each
function / department within the business
Tactics → short term plans (can be stopped / reversed if required)
Corporate objectives will be designed to meet the overall mission of the business
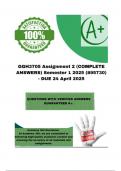
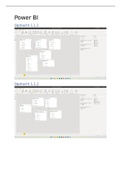
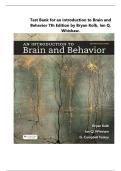
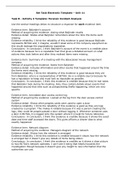
SWOT Analysis -
, Unit 7a - analysing the strategic position of a business
Ratio Formula What type of Explanation
ratio is it?
Gross profit Gross profit / revenue x 100 Profitability The total profit a company makes after
margin ratio deducting costs.
Operating Operating profit / revenue x Profitability The percentage of profit a company
profit margin 100 ratio produces from its operations before
subtracting taxes / investment charges
ROCE Operating profit / capital Profitability Compares operating profits earned with the
employed x 100 ratio amount of capital employed by the business.
This allows an assessment to be made of the
overall financial performance of the business.
A comparison can be made between the rate
of interest and the ROCE generated by the
business. The typical ROCE is expected to be
between 20-30%. A business can improve
ROCE by increasing its operating profits
without raising further capital or by reducing
the amount of capital employed (repaying
some of its long term borrowings).
Current ratio Current assets / current Liquidity ratio Measures the ability of a business to meet its
liabilities liabilities / debts over the next year or so. It is
expressed in the form of a ration. (2:1 current
assets to current liabilities). A business with
high current ratio values are not managing
their finances effectively (holding too much
cash / not investing). Firms can improve the
current ratio by raising more cash through
the sale of non-current assets / negotiations
of long term loans.
Gearing Non current assets / capital Liquidity ratio Measures the long term liquidity of a
employed x 100 business. Non-current liabilities are debts /
loans taken by the business. Total equity is
Capital employed = total the difference between a company’s assets
equity + non current and liabilities. Shareholders are unlikely to be
liabilities attracted to a business with a high gearing
ratio as their returns may be lower because
of the high level of interest payments. High
gearing = > 50% (more long term borrowing),
low gearing = 50%> (less long term
borrowing)
Inventories Costs of goods sold / Efficiency Measures the company’s success in
turnover average inventories held ratios converting inventories into sales. If the
company makes a profit on each sale, the
express no. of days taken on faster it sells its inventories, the greater the
average to sell inventories profit it earns. This ratio is only relevant to
= (inventories x 365) / cost manufacturing businesses. Low figure =
of sales obsolete inventories, high = efficiency
Business Missions & Corporate Objectives -
What factors influence the overall mission of a business?
- Culture
- Ethos & values
- Views of shareholders
- The value of stakeholders
What factors influence corporate objectives of a business?
- Short-termism → managers may seek short-term profit at the expense of
long-term investment in R&D
- Business ownership → owners in private sectors are likely to put emphasis on
profit maximisation / public sectors will put emphasis on providing for a societal
need
- Internal business environment
- External business environment
Missions, Corporate Objectives & Strategy -
Strategy → long term plans (difficult to reverse once implemented) → influences each
function / department within the business
Tactics → short term plans (can be stopped / reversed if required)
Corporate objectives will be designed to meet the overall mission of the business
SWOT Analysis -
, Unit 7a - analysing the strategic position of a business
Ratio Formula What type of Explanation
ratio is it?
Gross profit Gross profit / revenue x 100 Profitability The total profit a company makes after
margin ratio deducting costs.
Operating Operating profit / revenue x Profitability The percentage of profit a company
profit margin 100 ratio produces from its operations before
subtracting taxes / investment charges
ROCE Operating profit / capital Profitability Compares operating profits earned with the
employed x 100 ratio amount of capital employed by the business.
This allows an assessment to be made of the
overall financial performance of the business.
A comparison can be made between the rate
of interest and the ROCE generated by the
business. The typical ROCE is expected to be
between 20-30%. A business can improve
ROCE by increasing its operating profits
without raising further capital or by reducing
the amount of capital employed (repaying
some of its long term borrowings).
Current ratio Current assets / current Liquidity ratio Measures the ability of a business to meet its
liabilities liabilities / debts over the next year or so. It is
expressed in the form of a ration. (2:1 current
assets to current liabilities). A business with
high current ratio values are not managing
their finances effectively (holding too much
cash / not investing). Firms can improve the
current ratio by raising more cash through
the sale of non-current assets / negotiations
of long term loans.
Gearing Non current assets / capital Liquidity ratio Measures the long term liquidity of a
employed x 100 business. Non-current liabilities are debts /
loans taken by the business. Total equity is
Capital employed = total the difference between a company’s assets
equity + non current and liabilities. Shareholders are unlikely to be
liabilities attracted to a business with a high gearing
ratio as their returns may be lower because
of the high level of interest payments. High
gearing = > 50% (more long term borrowing),
low gearing = 50%> (less long term
borrowing)
Inventories Costs of goods sold / Efficiency Measures the company’s success in
turnover average inventories held ratios converting inventories into sales. If the
company makes a profit on each sale, the
express no. of days taken on faster it sells its inventories, the greater the
average to sell inventories profit it earns. This ratio is only relevant to
= (inventories x 365) / cost manufacturing businesses. Low figure =
of sales obsolete inventories, high = efficiency