SPSS Handleiding
Blauw: belangrijk om niet over het hoofd te zien
Rood: eerder behandelt hoe deze is te vinden
Oranje: vraag uit assignment
© : moet in de syntax staan
SPSS1 assignment 2: Descriptieve Statistiek
Frequentietabel:
1. Analyze à Descriptive statistics à Frequencies.
2. Sleep de variabelen die je wil gebruiken in de ‘Variable(s)’ box
3. Klik op OK
Histogram maken:
1. Navigeer naar grafieken à (Legacy dialogs indien bij jouw pc) à Histogram
2. Sleep de variabele die je wil gebruiken in de ‘Variable’ box
3. Vink het vakje ‘Display normal curve’ aan
4. Klik op OK
Kijk goed op hoeveel decimalen je moet afronden!
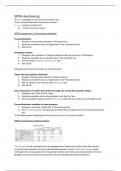
Tabel met descriptieve statistiek:
1. Analyze à Descriptive statistics à Descriptives
2. Sleep de variabelen die je wil gebruiken in de ‘Variable(s)’ box
3. Klik op ‘Options’ en vink het vakje ‘Variance’ aan
4. Klik op OK
Om antwoorden te vinden die buiten de range van verwachte waardes vallen:
1. Navigeer naar Data à Sort cases
2. Sleep de variabele die je wil gebruiken in de ‘Sort by’ box
3. Als je een gekke waarde vindt in Data view, selecteer je de hele rij en verwijder je die
De participanten verdelen in twee groepen:
1. Navigeer naar Data à Split file à Compare groups
2. Klik ‘compare groups’ en sleep de variabele die je wil gebruiken in de ‘Groups based on’
box
à De twee groepen vergelijk je door een descriptieve statistiek te maken
SPSS1 assignment 3: Missing Values
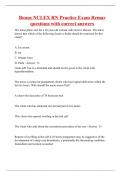
‘Percentage’ wordt verkregen door de waargenomen frequentie te delen door het totaal N
(inclusief respondenten met een ontbrekende waarde), terwijl ‘Geldig percentage’ wordt
verkregen door de waargenomen frequentie te delen door het aantal respondenten met een
geldige score (dus exclusief de personen die een ontbrekende waarde hadden).
Blauw: belangrijk om niet over het hoofd te zien
Rood: eerder behandelt hoe deze is te vinden
Oranje: vraag uit assignment
© : moet in de syntax staan
SPSS1 assignment 2: Descriptieve Statistiek
Frequentietabel:
1. Analyze à Descriptive statistics à Frequencies.
2. Sleep de variabelen die je wil gebruiken in de ‘Variable(s)’ box
3. Klik op OK
Histogram maken:
1. Navigeer naar grafieken à (Legacy dialogs indien bij jouw pc) à Histogram
2. Sleep de variabele die je wil gebruiken in de ‘Variable’ box
3. Vink het vakje ‘Display normal curve’ aan
4. Klik op OK
Kijk goed op hoeveel decimalen je moet afronden!
Tabel met descriptieve statistiek:
1. Analyze à Descriptive statistics à Descriptives
2. Sleep de variabelen die je wil gebruiken in de ‘Variable(s)’ box
3. Klik op ‘Options’ en vink het vakje ‘Variance’ aan
4. Klik op OK
Om antwoorden te vinden die buiten de range van verwachte waardes vallen:
1. Navigeer naar Data à Sort cases
2. Sleep de variabele die je wil gebruiken in de ‘Sort by’ box
3. Als je een gekke waarde vindt in Data view, selecteer je de hele rij en verwijder je die
De participanten verdelen in twee groepen:
1. Navigeer naar Data à Split file à Compare groups
2. Klik ‘compare groups’ en sleep de variabele die je wil gebruiken in de ‘Groups based on’
box
à De twee groepen vergelijk je door een descriptieve statistiek te maken
SPSS1 assignment 3: Missing Values
‘Percentage’ wordt verkregen door de waargenomen frequentie te delen door het totaal N
(inclusief respondenten met een ontbrekende waarde), terwijl ‘Geldig percentage’ wordt
verkregen door de waargenomen frequentie te delen door het aantal respondenten met een
geldige score (dus exclusief de personen die een ontbrekende waarde hadden).