,CHAPTER 1
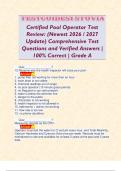
EXERCISE 1 a) Mean = 17.00, SD = 5.53, median = 17.00,
Range = 22,
IQR = 20 – 13 = 7.
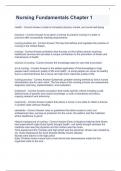
b) See boxplot.
c) A typical value for X is 17 which is both the mean and the
median. About half the values are between 13 and 20. The boxplot
shows that the upper tail is slightly longer, but difference is small
and mean and median are equal. This distribution is roughly
symmetric.
Chapter 1 – Page 1
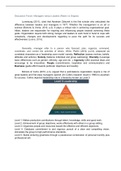
,EXERCISE 2
Variable Mean Median Variance Standard Shape
Deviation
WATER 7.125 1.500 452.864 21.28 extremely positively
skewed
VEG 1.120 0.00 4.327 2.080 extremely positively
skewed
FOWL 75.635 11.5 42197.33 205.420 extremely positively
skewed
WATER
Stem Leaf # Boxplot
14 9 1 *
13
12
11
10
9
8
7
6
5
4
3 13 2 *
2
1 05667 5 0
0 00000000000001111111111112222222222345556779 44 +--+--+
+ + + + + + + +
Multiply Stem.Leaf by 10**+1
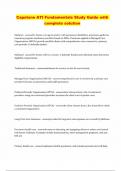
VEG
Stem Leaf # Boxplot
9 0 1 *
8
8 0 1 *
7
7 0 1 *
6
6
5
5 2 1 0
4
4 0 1 |
3 |
3 0 1 |
2 8 1 |
2 00002 5 |
1 58 2 +-----+
1 0002 4 | + |
0 58 2 | |
0 00000000000000000000000000000002 32 *-----*
+ + + + + +
Chapter 1 – Page 2
, FOWL
Stem Leaf # Boxplot
14 1 1 *
13
12
11
10
9
8
7
6
5
4
36 1 *
2124 3 0
1227888 6 0
000000000000000000000001111112222223335678 41 +--+--+
+ + + + + + + +-
Multiply Stem.Leaf by 10**+2
b) Frequency distribution for FOWL
Fowl Frequency Midpoint approximate mean = 5500/52
0 ≤ x < 100 41 50.0 = 105.8
100 ≤ x < 200 6 150.0
200 ≤ x < 300 3 250.0 approximate variance = 50746
300 ≤ x < 400 1 350.0
1400 ≤ x < 1500 1 1450.0
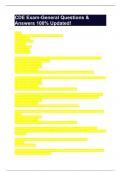
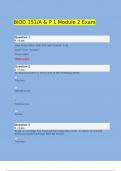
c) Scatterplots
fowl
1500
1400
1300
1200
1100
1000
900
800
700
600
500
400
300
200
100
0
0 1 2 3 4 5 6 7 8 9
veg
Aside from the single point with extraordinary number of waterfowl, there is little relationship.
Chapter 1 – Page 3
EXERCISE 1 a) Mean = 17.00, SD = 5.53, median = 17.00,
Range = 22,
IQR = 20 – 13 = 7.
b) See boxplot.
c) A typical value for X is 17 which is both the mean and the
median. About half the values are between 13 and 20. The boxplot
shows that the upper tail is slightly longer, but difference is small
and mean and median are equal. This distribution is roughly
symmetric.
Chapter 1 – Page 1
,EXERCISE 2
Variable Mean Median Variance Standard Shape
Deviation
WATER 7.125 1.500 452.864 21.28 extremely positively
skewed
VEG 1.120 0.00 4.327 2.080 extremely positively
skewed
FOWL 75.635 11.5 42197.33 205.420 extremely positively
skewed
WATER
Stem Leaf # Boxplot
14 9 1 *
13
12
11
10
9
8
7
6
5
4
3 13 2 *
2
1 05667 5 0
0 00000000000001111111111112222222222345556779 44 +--+--+
+ + + + + + + +
Multiply Stem.Leaf by 10**+1
VEG
Stem Leaf # Boxplot
9 0 1 *
8
8 0 1 *
7
7 0 1 *
6
6
5
5 2 1 0
4
4 0 1 |
3 |
3 0 1 |
2 8 1 |
2 00002 5 |
1 58 2 +-----+
1 0002 4 | + |
0 58 2 | |
0 00000000000000000000000000000002 32 *-----*
+ + + + + +
Chapter 1 – Page 2
, FOWL
Stem Leaf # Boxplot
14 1 1 *
13
12
11
10
9
8
7
6
5
4
36 1 *
2124 3 0
1227888 6 0
000000000000000000000001111112222223335678 41 +--+--+
+ + + + + + + +-
Multiply Stem.Leaf by 10**+2
b) Frequency distribution for FOWL
Fowl Frequency Midpoint approximate mean = 5500/52
0 ≤ x < 100 41 50.0 = 105.8
100 ≤ x < 200 6 150.0
200 ≤ x < 300 3 250.0 approximate variance = 50746
300 ≤ x < 400 1 350.0
1400 ≤ x < 1500 1 1450.0
c) Scatterplots
fowl
1500
1400
1300
1200
1100
1000
900
800
700
600
500
400
300
200
100
0
0 1 2 3 4 5 6 7 8 9
veg
Aside from the single point with extraordinary number of waterfowl, there is little relationship.
Chapter 1 – Page 3