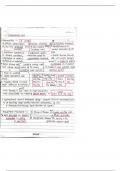
Topic: Psychology- Data Analysis: Descriptive Statistics
Key points/ Notes/Diagrams:
Main Ideas/
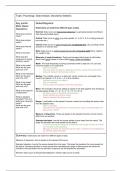
Distinctions are made from different types of data.
Questions:
Nominal: Data occurs as frequencies/categories (e.g grouping people according to
What does nominal their favourite football team).
mean?
Ordinal: Data occur as ranks (e.g exam grades- A*, A, B, C, D, E or rating scale put
What does ordinal into order etc.)
mean?
Interval: Data occurs as units of equal size- no absolute zero. (E.g counting correct
What does interval answers in a memory test).
mean?
Ratio: Data occurs as units of equal size but with a true zero point (time, height in
What is the ratio? cm, weight in kg)
What does the Measures of central tendency- These are averages which gives us information
measures of central about most typical values in a set of data (mean, mode and median),
tendency mean?
Mode- The most frequently occurring score/value within a data set. You can also
What is the mode? have two modes or no mode at all.
What are the pros - Easy to calculate
and cons of it? - The only option for data in categories (nominal- e.g list of favourite films)
- Does not represent the data as a whole
What is the meaning?
What are the pros Median- The middle value in a data set, when scores are arranged from
and cons of it? lowest to highest. (1,2,3,4,5 → 3 is the median).
- Extreme scores do not affect it
What is the range? - Easy to calculate
What are the pros - Not all scores are included in the final calculation
and cons of it?
Mean- The average is found by adding all values in the data together and dividing by
What is the measure the total pieces of data. (1 + 2 + 3 + 4 + 5 = 15. = 3).
of dispersion? - All data is used, so therefore representative
- Easily distorted by extreme values
What is standard - Doesn’t represent the data overall
deviation? How is it
better than using the Range- A calculation on the spread of scores, worked out by taking the lowest value
range? from the highest value.
What are the pros - Easy to calculate
and cons of it? - Only takes into account the two most extreme values- unrepresentative of
data set as a whole
Measure of dispersion- These are based on the spread of scores, how far scores
differ from one another.
Standard deviation- how far the scores deviate (move away from the mean). The
larger the deviation the more spread out the data is.
- A much more precise measure of dispersion than range because all values
are included in the calculation
- Because all values are included, like the mean, The SD can be distorted by
an extreme value (anomaly).
Summary: Distinctions are made from different types of data.
Measure of dispersion- they’re based on the spread of the score,
Standard deviation- how far the scores deviate from the mean. The larger the deviation the more spread out
the data is. Standard deviation is more precise than calculating the range of data because all values are
included in the calculation and not just ttwo, however it can be distorted by anomalies.
Nominal- data occurs as frequencies/categories. Ordinal- data occurs as ranks.
Key points/ Notes/Diagrams:
Main Ideas/
Distinctions are made from different types of data.
Questions:
Nominal: Data occurs as frequencies/categories (e.g grouping people according to
What does nominal their favourite football team).
mean?
Ordinal: Data occur as ranks (e.g exam grades- A*, A, B, C, D, E or rating scale put
What does ordinal into order etc.)
mean?
Interval: Data occurs as units of equal size- no absolute zero. (E.g counting correct
What does interval answers in a memory test).
mean?
Ratio: Data occurs as units of equal size but with a true zero point (time, height in
What is the ratio? cm, weight in kg)
What does the Measures of central tendency- These are averages which gives us information
measures of central about most typical values in a set of data (mean, mode and median),
tendency mean?
Mode- The most frequently occurring score/value within a data set. You can also
What is the mode? have two modes or no mode at all.
What are the pros - Easy to calculate
and cons of it? - The only option for data in categories (nominal- e.g list of favourite films)
- Does not represent the data as a whole
What is the meaning?
What are the pros Median- The middle value in a data set, when scores are arranged from
and cons of it? lowest to highest. (1,2,3,4,5 → 3 is the median).
- Extreme scores do not affect it
What is the range? - Easy to calculate
What are the pros - Not all scores are included in the final calculation
and cons of it?
Mean- The average is found by adding all values in the data together and dividing by
What is the measure the total pieces of data. (1 + 2 + 3 + 4 + 5 = 15. = 3).
of dispersion? - All data is used, so therefore representative
- Easily distorted by extreme values
What is standard - Doesn’t represent the data overall
deviation? How is it
better than using the Range- A calculation on the spread of scores, worked out by taking the lowest value
range? from the highest value.
What are the pros - Easy to calculate
and cons of it? - Only takes into account the two most extreme values- unrepresentative of
data set as a whole
Measure of dispersion- These are based on the spread of scores, how far scores
differ from one another.
Standard deviation- how far the scores deviate (move away from the mean). The
larger the deviation the more spread out the data is.
- A much more precise measure of dispersion than range because all values
are included in the calculation
- Because all values are included, like the mean, The SD can be distorted by
an extreme value (anomaly).
Summary: Distinctions are made from different types of data.
Measure of dispersion- they’re based on the spread of the score,
Standard deviation- how far the scores deviate from the mean. The larger the deviation the more spread out
the data is. Standard deviation is more precise than calculating the range of data because all values are
included in the calculation and not just ttwo, however it can be distorted by anomalies.
Nominal- data occurs as frequencies/categories. Ordinal- data occurs as ranks.