Methodology in Marketing and Strategy Research (MSSR)
2018-2019
Summary clips V.Blazevic
Inhoudsopgave
Methods subject 1 – Factor analysis...................................................................................... 2
1.1 Intro .............................................................................................................................. 2
1.2 Conducting a factor analysis ....................................................................................... 5
1.3 Selecting an Extraction Method .................................................................................. 7
1.4 Determining the Number of Factors and Rotation .................................................. 11
1.5 Interpreting Factors, using factors in other analyses and determining model fit .. 16
Methods subject 2 – AN(C)OVA ........................................................................................... 21
2.1 Introduction ............................................................................................................... 21
2.2 Understanding the logic ............................................................................................ 23
2.3 Research process & application ................................................................................ 25
2.4 N-way ANOVA ............................................................................................................ 29
2.5 Assumptions and Interpretation ............................................................................... 33
Methods subject 3 – Regression analysis ............................................................................ 37
3.1 Introduction ............................................................................................................... 37
3.2 Process ....................................................................................................................... 40
3.3 Assumptions, Estimation and Model Fit ................................................................... 43
3.4 Issues in interpretations ............................................................................................ 47
3.5 Moderating Effects in MRA ....................................................................................... 54
Methods subject 4 – Partial Least Squares.......................................................................... 57
1.1 Introduction Structural Equation Modeling ............................................................. 57
4.2 Process ....................................................................................................................... 61
4.3 Assumptions and requirements ................................................................................ 65
4.4 Assessing measurement model ................................................................................ 67
4.5 Assessing structural model........................................................................................ 71
1
,Methods subject 1 – Factor analysis
1.1 Intro
Purpose
Estimate a model which explains variance/covariance between a set of observed variables
(in a population) by a set of (fewer) unobserved factors & weightings. Important here are:
the observed variables. So, collected data or so... and what you would like to do, is you want
to understand the variance/covariance between this set of observed variables. So how do
they really interrelate with each other. With that you want to understand how unobserved
factors or other dimensions play a role within this dataset of observed variables.
Example
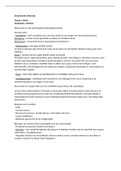
First you collect the data. So, for example we want to know how you perceive your fairness
of grading and how satisfied you as students are. This we plugged in to a dataset. There we
have the rows. In these rows we have each respondent, so each row is one respondent. Here
respondent number 243 and then for each observed variable we have the number that this
person scored. In the columns we do have all the observations from the different items. So,
for each respondent how he or she perceived Grading 3. This makes up your dataset:
Now you are interested in how these six items relate to each other. So, you want to know
for example how together Gra 1, Gra 2 and Gra 3 form the perception of fair grading. And
this you do by:
→ FACTOR ANALYSIS
What is factor analysis?
• Interdependence technique, you are really interested in how these items interrelate
with each other. Not yet interested in prediction or anything.
• Define structure among variables (observed variables in the dataset and then again
find out how they relate to each other).
2
, • Interrelationships among large numbers of variables to identify underlying
dimensions → factors. You do this mainly for two purposes:
Data summarization (you want to summarize data and you want to understand these
higher order dimensions/factors and reduction of the data. You want to reduce your
observations in order to use them in other analysis.
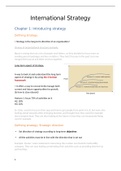
This is a measurement model (figure).
So, you have a construct, noted by the Greek term in the right and you have the underlying
items X1, X2, X3 and so on. These then together form for example the construct X. We are
also interested in the measurement error (on the left) are there any biases which might
influenced how we measured these items. So, with factor analysis you can assess this type of
measurement error.
Furthermore, here below we see the entire measurement model we have four constructs
with different items, and we are especially interested in the areas of the dotted lines where
we assess the measurement for each construct.
3
, Why do we do multi-item measurement at all?
• Increases reliability and validity of measures. And that is what we are interested in,
because we want to interpret and then later on what we found out our survey and
should be based on reliable and valid measures.
• Allows measurement assessment. We can assess:
- Measurement error
- Reliability
- Validity
• You can use that in two forms of measurement models:
- Formative (emerging) & Reflective (latent) → reflective is what you see in marketing
and strategy. There is a construct and the items kind of reflect this kind of construct.
But for the formative you have more items and therefore they emerge as the
construct.
And for these reflective measurement models we use factor analysis. And we want to assess
reliability and validity.
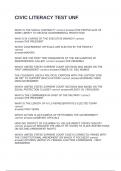
→ The black dots are the data-points in your sample.
Valid = on target
Reliable = clustered together
Reflective measurement models
• Direction of causality is from construct to measure.
• (They usually are) correlated indicators. So, the items correlate with each other and
together these correlations are used in the factor analysis to explain these dimensions.
• Takes measurement error into account at item level.
• Validity of the items is usually tested with → FACTOR ANALYSIS.
4
2018-2019
Summary clips V.Blazevic
Inhoudsopgave
Methods subject 1 – Factor analysis...................................................................................... 2
1.1 Intro .............................................................................................................................. 2
1.2 Conducting a factor analysis ....................................................................................... 5
1.3 Selecting an Extraction Method .................................................................................. 7
1.4 Determining the Number of Factors and Rotation .................................................. 11
1.5 Interpreting Factors, using factors in other analyses and determining model fit .. 16
Methods subject 2 – AN(C)OVA ........................................................................................... 21
2.1 Introduction ............................................................................................................... 21
2.2 Understanding the logic ............................................................................................ 23
2.3 Research process & application ................................................................................ 25
2.4 N-way ANOVA ............................................................................................................ 29
2.5 Assumptions and Interpretation ............................................................................... 33
Methods subject 3 – Regression analysis ............................................................................ 37
3.1 Introduction ............................................................................................................... 37
3.2 Process ....................................................................................................................... 40
3.3 Assumptions, Estimation and Model Fit ................................................................... 43
3.4 Issues in interpretations ............................................................................................ 47
3.5 Moderating Effects in MRA ....................................................................................... 54
Methods subject 4 – Partial Least Squares.......................................................................... 57
1.1 Introduction Structural Equation Modeling ............................................................. 57
4.2 Process ....................................................................................................................... 61
4.3 Assumptions and requirements ................................................................................ 65
4.4 Assessing measurement model ................................................................................ 67
4.5 Assessing structural model........................................................................................ 71
1
,Methods subject 1 – Factor analysis
1.1 Intro
Purpose
Estimate a model which explains variance/covariance between a set of observed variables
(in a population) by a set of (fewer) unobserved factors & weightings. Important here are:
the observed variables. So, collected data or so... and what you would like to do, is you want
to understand the variance/covariance between this set of observed variables. So how do
they really interrelate with each other. With that you want to understand how unobserved
factors or other dimensions play a role within this dataset of observed variables.
Example
First you collect the data. So, for example we want to know how you perceive your fairness
of grading and how satisfied you as students are. This we plugged in to a dataset. There we
have the rows. In these rows we have each respondent, so each row is one respondent. Here
respondent number 243 and then for each observed variable we have the number that this
person scored. In the columns we do have all the observations from the different items. So,
for each respondent how he or she perceived Grading 3. This makes up your dataset:
Now you are interested in how these six items relate to each other. So, you want to know
for example how together Gra 1, Gra 2 and Gra 3 form the perception of fair grading. And
this you do by:
→ FACTOR ANALYSIS
What is factor analysis?
• Interdependence technique, you are really interested in how these items interrelate
with each other. Not yet interested in prediction or anything.
• Define structure among variables (observed variables in the dataset and then again
find out how they relate to each other).
2
, • Interrelationships among large numbers of variables to identify underlying
dimensions → factors. You do this mainly for two purposes:
Data summarization (you want to summarize data and you want to understand these
higher order dimensions/factors and reduction of the data. You want to reduce your
observations in order to use them in other analysis.
This is a measurement model (figure).
So, you have a construct, noted by the Greek term in the right and you have the underlying
items X1, X2, X3 and so on. These then together form for example the construct X. We are
also interested in the measurement error (on the left) are there any biases which might
influenced how we measured these items. So, with factor analysis you can assess this type of
measurement error.
Furthermore, here below we see the entire measurement model we have four constructs
with different items, and we are especially interested in the areas of the dotted lines where
we assess the measurement for each construct.
3
, Why do we do multi-item measurement at all?
• Increases reliability and validity of measures. And that is what we are interested in,
because we want to interpret and then later on what we found out our survey and
should be based on reliable and valid measures.
• Allows measurement assessment. We can assess:
- Measurement error
- Reliability
- Validity
• You can use that in two forms of measurement models:
- Formative (emerging) & Reflective (latent) → reflective is what you see in marketing
and strategy. There is a construct and the items kind of reflect this kind of construct.
But for the formative you have more items and therefore they emerge as the
construct.
And for these reflective measurement models we use factor analysis. And we want to assess
reliability and validity.
→ The black dots are the data-points in your sample.
Valid = on target
Reliable = clustered together
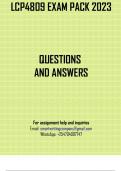
Reflective measurement models
• Direction of causality is from construct to measure.
• (They usually are) correlated indicators. So, the items correlate with each other and
together these correlations are used in the factor analysis to explain these dimensions.
• Takes measurement error into account at item level.
• Validity of the items is usually tested with → FACTOR ANALYSIS.
4