Statistics
Introduction
Elk hoorcollege geeft Eric een aantal objectives voor die betreffende les: wat zou je moeten weten
aan het einde van de les?
De eerste drie lessen zijn puur theorie ter introductie. Vanaf volgende week hebben we Q&A lecture
op de dinsdagochtend en case lecture op dinsdagmiddag. Op vrijdag zijn tutorial lectures. Elke week
is er een opdracht: staan al op BlackBoard.
Tentamen is MC vragen met boek er bij.
Lecture 1
After this lecture and studying the resources, you will be able to:
1. Describe, calculate and interpret measures of central tendency, dispersion and relative
standing of variables and articulate and substantiate your findings and decision(s)
adequately.
2. Describe, determine and interpret the shape of the distribution of variables of different
measurement levels and articulate and substantiate your findings and decision(s) adequately.
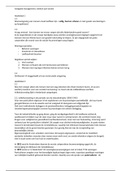
We gebruiken Stephen Toulmin’s model of argumentation: claim, ground and warrant. Je maakt een
claim (choice, decision, opinion), je hebt informatie nodig om deze claim te maken, dat is ground
(information, statistical output, type of research
questions, measurement levels, results). Om van
ground naar claim te komen heb je echter invloed van
warrant (rules and principles, for example the mean or
median or mode, standard deviation).
Statistics is niet alleen data, maar ook een empirische cyclus die daar aan vooraf gaat: literatuur
studie, conceptueel model en onderzoeksprobleem. Je hebt andere data nodig als je statistische
vragen hebt dan wanneer je beschrijvende vragen hebt. Verschillende onderzoeksvragen zijn dus
gerelateerd aan verschillende soorten analysis. Ook bij de preparation en construction van je data is
statistical analysis al belangrijk: het maken van een likert scale bijvoorbeeld.
Statistics = collecting, classifying, summarizing, organizing, analyzing and interpreting numerical
information. A means to answer research questions (and to test hypothesis).
Statisics do not provide us any scientific proof: there is always a small chance that you made the
wrong decision. There is a substantial support, no proof.
There are two types of research questions:
1. Descriptive: beschrijvend
a. Static: one moment in time
b. Dynamic: a question where a timeline is involved (comparative static analysis: only
two time periods involved)
2. Explanatory: related to causal relations (cause – effect) (signal words: determine, has an
effect, leads to, has the effect)
a. Static: one moment in time
, b. Dynamic: again, over time (signal word: “change”)
The different types of questions doe have different items. We only do the static questions.
Descriptive static questions:
o Central tendency, dispersion
o Variables and probabilities
o Testing hypotheses
o Testing correlation
o Testing differences between 2 groups
Explanatory static questions:
o Testing of causal relationships (simple and multivariate regression)
o Testing differences between 2 groups
Explanatory questions do almost always come after descriptive questions. Je have to describe
something before you can explain it.
The starting point of an analysis is the data matrix. This is nothing more than a spreadsheet in Excel
(little bit more fancier but in essence the same). In the column there are units of analysis, in the row
there is the information you have found.
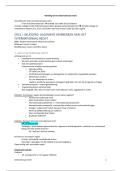
Deze slide gebruikt Eric altijd bij het
uitleggen van statistics. First: what kind
of research question is involved. Then:
what variables are available for me:
nominal, ordinal, interval or ratio. Are
there relationships involved between
the variables: when you only want to
describe some variables, there is no
relation and no conceptual models:
univariate. Most of the analysis have
criteria that have to be met before you
can interpret the data. You have to
know the measurement level and the
shape of distribution et cetera.
Research question: What is the mean income of the Dutch inhabitants with a paid job in 2014?
Descriptive static question
Definition of income: income is the payment one gets from a regular job or social support.
Measurement of income: income per month after taxes: most valid for people recognizes their
salaries best from bank receipts (Eric thinks netto income after taxes is more valid).
Survey question: What is your contemporary income per month after taxes?
Measurement level: ratio (want er is een nulpunt)
Downside: honesty of the participants, you can lie about the answer --> validation problem
, Alternative: Would you be so kind to indicate which of the following categories includes your
contemporary income per month after taxes?
1. less than € 1500,-
2. from € 1500,- until € 2000,-
3. from € 2000,- until € 3000,-
4. from € 3000,- until € 4000,-
5. from € 4000,- until € 5000,-
6. € 5000,- or more
Level of measurement: ordinal
You gain some validity, but you lose the measurement level. So there are consequences.
Data analysis: when you describe your data you can use a frequency table. To describe sets of data
you have to do measurement of central tendency and dispersion.
Central tendency: where is the centre of your variable: the centre of all the scores that I measure
Dispersion: how are all the scores dispersed around the centre
Shape: there are different shapes, the bell shape is the normal distribution (symetric). You can also
have different shapes: negatively stewed (tail on the left side), positively stewed (tail on the right).
We have three measures: mode, median
and mean. Sometimes you have a
population symbol and a sample symbol.
The mode can be applied to all
measurement levels. This doesn’t mean
that the mode is the most adequate one. The median can only be applied to ordinal, interval and
ratio. The mean can only be applied to interval and ratio. The higher the measurement level, the
more measures you can use (with nominal you only can use the mode).
Dispersion is about the different scores
around the centre. With nominal there is
no ranking involved so there is no
dispersion. The interquartile range can
only be used in relation with the median.
When you use the mean, the standard
deviation is involved. This is the general
difference of all the scores related to the mean. The variance is the mean difference of all these
different scores. You can calculate all these difference related to that mean. You add up all these
differences and you calculate the mean difference: variance. You have to square it, because
otherwise you end up with zero, because you have minus 500 and plus 500. The standard deviation
has the original level of measurement (squaring takes this away, so SD has this as an advantage).
The best possible measures are the mean and the standard deviation. There are exceptions.
When there is a normal distribution, the mean
and the median are the same thing. The point
is that the mean and standard deviation might
not be the best measure. Example:
Introduction
Elk hoorcollege geeft Eric een aantal objectives voor die betreffende les: wat zou je moeten weten
aan het einde van de les?
De eerste drie lessen zijn puur theorie ter introductie. Vanaf volgende week hebben we Q&A lecture
op de dinsdagochtend en case lecture op dinsdagmiddag. Op vrijdag zijn tutorial lectures. Elke week
is er een opdracht: staan al op BlackBoard.
Tentamen is MC vragen met boek er bij.
Lecture 1
After this lecture and studying the resources, you will be able to:
1. Describe, calculate and interpret measures of central tendency, dispersion and relative
standing of variables and articulate and substantiate your findings and decision(s)
adequately.
2. Describe, determine and interpret the shape of the distribution of variables of different
measurement levels and articulate and substantiate your findings and decision(s) adequately.
We gebruiken Stephen Toulmin’s model of argumentation: claim, ground and warrant. Je maakt een
claim (choice, decision, opinion), je hebt informatie nodig om deze claim te maken, dat is ground
(information, statistical output, type of research
questions, measurement levels, results). Om van
ground naar claim te komen heb je echter invloed van
warrant (rules and principles, for example the mean or
median or mode, standard deviation).
Statistics is niet alleen data, maar ook een empirische cyclus die daar aan vooraf gaat: literatuur
studie, conceptueel model en onderzoeksprobleem. Je hebt andere data nodig als je statistische
vragen hebt dan wanneer je beschrijvende vragen hebt. Verschillende onderzoeksvragen zijn dus
gerelateerd aan verschillende soorten analysis. Ook bij de preparation en construction van je data is
statistical analysis al belangrijk: het maken van een likert scale bijvoorbeeld.
Statistics = collecting, classifying, summarizing, organizing, analyzing and interpreting numerical
information. A means to answer research questions (and to test hypothesis).
Statisics do not provide us any scientific proof: there is always a small chance that you made the
wrong decision. There is a substantial support, no proof.
There are two types of research questions:
1. Descriptive: beschrijvend
a. Static: one moment in time
b. Dynamic: a question where a timeline is involved (comparative static analysis: only
two time periods involved)
2. Explanatory: related to causal relations (cause – effect) (signal words: determine, has an
effect, leads to, has the effect)
a. Static: one moment in time
, b. Dynamic: again, over time (signal word: “change”)
The different types of questions doe have different items. We only do the static questions.
Descriptive static questions:
o Central tendency, dispersion
o Variables and probabilities
o Testing hypotheses
o Testing correlation
o Testing differences between 2 groups
Explanatory static questions:
o Testing of causal relationships (simple and multivariate regression)
o Testing differences between 2 groups
Explanatory questions do almost always come after descriptive questions. Je have to describe
something before you can explain it.
The starting point of an analysis is the data matrix. This is nothing more than a spreadsheet in Excel
(little bit more fancier but in essence the same). In the column there are units of analysis, in the row
there is the information you have found.
Deze slide gebruikt Eric altijd bij het
uitleggen van statistics. First: what kind
of research question is involved. Then:
what variables are available for me:
nominal, ordinal, interval or ratio. Are
there relationships involved between
the variables: when you only want to
describe some variables, there is no
relation and no conceptual models:
univariate. Most of the analysis have
criteria that have to be met before you
can interpret the data. You have to
know the measurement level and the
shape of distribution et cetera.
Research question: What is the mean income of the Dutch inhabitants with a paid job in 2014?
Descriptive static question
Definition of income: income is the payment one gets from a regular job or social support.
Measurement of income: income per month after taxes: most valid for people recognizes their
salaries best from bank receipts (Eric thinks netto income after taxes is more valid).
Survey question: What is your contemporary income per month after taxes?
Measurement level: ratio (want er is een nulpunt)
Downside: honesty of the participants, you can lie about the answer --> validation problem
, Alternative: Would you be so kind to indicate which of the following categories includes your
contemporary income per month after taxes?
1. less than € 1500,-
2. from € 1500,- until € 2000,-
3. from € 2000,- until € 3000,-
4. from € 3000,- until € 4000,-
5. from € 4000,- until € 5000,-
6. € 5000,- or more
Level of measurement: ordinal
You gain some validity, but you lose the measurement level. So there are consequences.
Data analysis: when you describe your data you can use a frequency table. To describe sets of data
you have to do measurement of central tendency and dispersion.
Central tendency: where is the centre of your variable: the centre of all the scores that I measure
Dispersion: how are all the scores dispersed around the centre
Shape: there are different shapes, the bell shape is the normal distribution (symetric). You can also
have different shapes: negatively stewed (tail on the left side), positively stewed (tail on the right).
We have three measures: mode, median
and mean. Sometimes you have a
population symbol and a sample symbol.
The mode can be applied to all
measurement levels. This doesn’t mean
that the mode is the most adequate one. The median can only be applied to ordinal, interval and
ratio. The mean can only be applied to interval and ratio. The higher the measurement level, the
more measures you can use (with nominal you only can use the mode).
Dispersion is about the different scores
around the centre. With nominal there is
no ranking involved so there is no
dispersion. The interquartile range can
only be used in relation with the median.
When you use the mean, the standard
deviation is involved. This is the general
difference of all the scores related to the mean. The variance is the mean difference of all these
different scores. You can calculate all these difference related to that mean. You add up all these
differences and you calculate the mean difference: variance. You have to square it, because
otherwise you end up with zero, because you have minus 500 and plus 500. The standard deviation
has the original level of measurement (squaring takes this away, so SD has this as an advantage).
The best possible measures are the mean and the standard deviation. There are exceptions.
When there is a normal distribution, the mean
and the median are the same thing. The point
is that the mean and standard deviation might
not be the best measure. Example: