

Learning unit 7
Keynesian model with government sector
Now we relax some of those assumptions starting with the
one that assumed there was no government sector……..
o Introduce the government into the Keynesian model.
Government sector (in this model) is comprised of…
o Government spending (G) and
o Taxes (T and t)
What is the nature of G in the model?
o G is not affected by the level of Y
o G is therefore AUTONOMOUS
o Refer to figure 18-1 in the textbook and make sure you can
draw the graph showing AUTONOMOUS G.
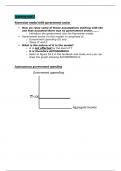
Autonomous government spending
Government appending
G=100
Aggregate income
,Adding G to the model
Impact of government spending on aggregate spening
Aggregate spending A=C+I+G
A=C+I
A=320
A=220
G=100
Aggregate income
Effect of G on the equilibrium level
Aggregate spending A=Y A1=C+I+G
A=C+I
A1=320 NOTICE the increase in Y is
greater than the increase in
government spending.
A=220
Y Y1
Aggregate income
Adding G into the equilibrium equation:
, 1
Y= (C + I + G)
1−c
G increases Autonomous spending: A = C + I + G
As A increases the Aggregate spending curve moves upwards and the
equilibrium level of income (Y) increases.
This is referred to as EXPANSIONARY fiscal policy.
SUMMARISE THE EFFECTS OF G on the model:
Increases A
Does not affect the multiplier.
Causes the equilibrium level of income to increase.
ADDING TAXES
Government must collect taxes to be able to spend.
Taxes are a LEAKAGE from the circular flow. More taxes means less spending.
There is a clear link between the amount of tax paid and the level of income or
spending in the economy.
Consider the following example:
Assume the level of income in the economy is R100m and a proportional income tax of 10% is
levied on all income.
Y = R100m
Tax rate (t) = 10%
The amount of tax revenue (T) collected will be?
T = 10% x R100m
Based on this we can say: T = tY
Where t = the tax rate; Y = level of income
IMPACT OF TAXES ON OUTPUT (Y) AND CONSUMPTION (C).
What is the impact of taxes on Y?
Distinguish between total income (Y) and disposable income (Yd).
Difference between Y and Yd.
-Yd = Y - T
-Also: Yd = Y – tY
- = (1 – t)Y
What is the impact of T (taxes) on C?
C = C + cYd
Substitute for Yd
C = C + c(1 – t)Y
, Consumption will decrease because we have to pay taxes before we
can spend!
IMPACT OF TAXES ON THE MULTIPLIER
Remember that the marginal propensity to consume (c) is that portion of each additional
unit of income (Y) that is consumed or spent.
Introducing taxes means that the marginal propensity to consume decreases (c(1-
t)).
The multiplier is also smaller.
1
Multiplier withtaxes :
1−c (1−t)
EFFECT OF TAXES ON EQUILIBRIUM LEVEL OF OUTPUT
Taxes cause a swivel on the A-curve
Aggregate spending A=Y
A=C+I+G
A1=C+I=G
A=320
Y1 Y
Aggregate income
Keynesian model with government sector
Now we relax some of those assumptions starting with the
one that assumed there was no government sector……..
o Introduce the government into the Keynesian model.
Government sector (in this model) is comprised of…
o Government spending (G) and
o Taxes (T and t)
What is the nature of G in the model?
o G is not affected by the level of Y
o G is therefore AUTONOMOUS
o Refer to figure 18-1 in the textbook and make sure you can
draw the graph showing AUTONOMOUS G.
Autonomous government spending
Government appending
G=100
Aggregate income
,Adding G to the model
Impact of government spending on aggregate spening
Aggregate spending A=C+I+G
A=C+I
A=320
A=220
G=100
Aggregate income
Effect of G on the equilibrium level
Aggregate spending A=Y A1=C+I+G
A=C+I
A1=320 NOTICE the increase in Y is
greater than the increase in
government spending.
A=220
Y Y1
Aggregate income
Adding G into the equilibrium equation:
, 1
Y= (C + I + G)
1−c
G increases Autonomous spending: A = C + I + G
As A increases the Aggregate spending curve moves upwards and the
equilibrium level of income (Y) increases.
This is referred to as EXPANSIONARY fiscal policy.
SUMMARISE THE EFFECTS OF G on the model:
Increases A
Does not affect the multiplier.
Causes the equilibrium level of income to increase.
ADDING TAXES
Government must collect taxes to be able to spend.
Taxes are a LEAKAGE from the circular flow. More taxes means less spending.
There is a clear link between the amount of tax paid and the level of income or
spending in the economy.
Consider the following example:
Assume the level of income in the economy is R100m and a proportional income tax of 10% is
levied on all income.
Y = R100m
Tax rate (t) = 10%
The amount of tax revenue (T) collected will be?
T = 10% x R100m
Based on this we can say: T = tY
Where t = the tax rate; Y = level of income
IMPACT OF TAXES ON OUTPUT (Y) AND CONSUMPTION (C).
What is the impact of taxes on Y?
Distinguish between total income (Y) and disposable income (Yd).
Difference between Y and Yd.
-Yd = Y - T
-Also: Yd = Y – tY
- = (1 – t)Y
What is the impact of T (taxes) on C?
C = C + cYd
Substitute for Yd
C = C + c(1 – t)Y
, Consumption will decrease because we have to pay taxes before we
can spend!
IMPACT OF TAXES ON THE MULTIPLIER
Remember that the marginal propensity to consume (c) is that portion of each additional
unit of income (Y) that is consumed or spent.
Introducing taxes means that the marginal propensity to consume decreases (c(1-
t)).
The multiplier is also smaller.
1
Multiplier withtaxes :
1−c (1−t)
EFFECT OF TAXES ON EQUILIBRIUM LEVEL OF OUTPUT
Taxes cause a swivel on the A-curve
Aggregate spending A=Y
A=C+I+G
A1=C+I=G
A=320
Y1 Y
Aggregate income


