Concepts Description
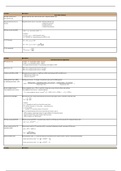
Time Value of Money
Nominal risk‐free rate / Nominal risk‐free rate = Real risk‐free rate + expected inflation rate
Real risk‐free rate
Required interest rate on a Required interest rate on a securities = Nominal risk‐free rate
security + default risk premium
+ liquidity premium
+ maturity risk premium
Effective annual rate (EAR) 1 1
In which :
FV / PV formula 1 ⁄
1 ⁄
1 ⁄
PV of a perpetuity
⁄
Concepts Description
Discounted Cash Flow Applications
NPV decision rule ‐ (+) NPV → ↑ shareholder wealth → Accept
‐ (‐) NPV → ↓ shareholder wealth → Reject
‐ 2 mutually exclusive projects → Accept project with higher (+) NPV
IRR decision rule ‐ IRR > Firm's required rate of return → Accept
‐ IRR < Firm's required rate of return → Reject
Problems with NPV and IRR Mutually exclusive projects → might have conflict result between NPV and IRR, due to :
‐ Different size of initial costs
‐ Different timing of CF
Holding period return (HPR) Holding period return : % change in investment value over the holding period
(or Holding period yield ‐ HPY)
1
Money‐weighted return / Money weighted return : IRR on a portfolio, taking into account all cash inflows and outflows
Time‐weighted rate of return Time‐weighted rate of return : compound growth
1 1 1 ⋯ 1
Bank discount yield (BDY) Bank discount yield : express the dollar discount from the face (par) value as a fraction of the face value
360
In which :
BDY is not representative of the return earned by an investor, due to :
‐ BDY annualises using simple interest → ignore effects of compound interest
‐ Based on bond's Face value instead of purchase price
‐ BDY annualises on a 360‐day year
Effective annual yield (EAY) Effective annual yield (EAY) : annualised value, based on a 365‐day year, that accounts for compound interest rate
1 / 1
Money market yield (or CD Money market yield (or CD equivalent yield) : annualised holding period yield, assuming a 360‐day year
equivalent yield)
360⁄
360
360
Bond equivalent yield Bond equivalent yield : 2 × semiannual discount rate (because the coupon interest is paid in 2 semiannual payments)
2 1 1
2 1 . 1
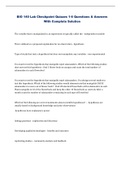
Concepts Description
, Statistical Concept and Market Returns
Statistic / Statistic : refer to data and methods used to analyse data
Descriptive statistic / Descriptive statistics : summarise the important characteristics of large data sets
Inferential statistic / Inferential statistics : used to make foreasts, estimates, or judgements about a large data seton the basis of statistical characteristics of a smaller sample set
Population / Population : set of all possible members of a stated group
Sample Sample : subset of the population
Types of measurement scales 4 major categories of measurement scales :
1. Nominal scale ‐ data is put into categories that have no particular order
2. Ordinal scale ‐ data is put into categories that could be ordered based on several characteristic
3. Interval scale ‐ Differences in data values are meaningful, but ratios are not meaningful
4. Ratio scale ‐ Ratios are meaningful ; zero represents the complete absence of the characteristic being measured
Parameter / Parameter : any measurable characteristic of a population
Sample statistic / Sample statistic : characteristic of a sample
Frequency distribution / Frequency distribution : summary of statistical data, by assigning sample data into specific intervals (groups). Procedures to construct a frequency distribution :
Relative frequency / ‐ Step 1 : Define the intervals ‐ Too few intervals → data might be too broadly summarised ; Too many intervals → data might not be summarised enough
Cummulative frequency ‐ Step 2 : Tally (assign) the observations
‐ Step 3 : Count the observations
Relative frequency = Absolute frequency ÷ Total number of observations
Cumulative frequency for an interval = sum of all absolute / relative frequencies for all values ≤ that interval's max value
Histogram / Histogram : bar chart of data that has been grouped into a frequency distribution
Frequency polygon
Frequency polygon :
‐ Horizontal axis : midpoint of each interval
‐ Vertical axis : absolute frequency
‐ Each point is connected with a straight line
Measurement of central tendency Measurement of central tendency : to identify the center, or average, of a data set → used to represent the typical, or expected, value in the data set
: Population mean / Sample mean Arimethic mean : sum of all observation value divided by the number of observations
/ arimethic mean / weighted Population mean : mean of all observed values in the population
mean / geometric mean / ∑
harmonic mean / median / mode
Sample mean : mean of all sample values
∑
Weighted mean :
⋯
Geometrical mean :
⁄
⋯ ⋯
Harmonic mean : used to find the average purchasing price
1
∑
In which :
Median : midpoint of a data set when the data is arranged from smallest to largest
Mode : Value that occurs ost frequently in a data set
‐ Unimodal : 1 value that occurs most frequently
‐ Bimodal : 2 values that occur most frequently
‐ Trimodal : 3 values that occur most frequently
Quartiles / Quartiles ‐ distribution is divided into quarters
Quintiles / Quintiles ‐ distribution is divided into fifth
Deciles / Deciles ‐ distribution is divided into tenth
Percentiles Percentiles ‐ distribution is divided into hundredth (percents)
Formula for the position of the observation at given percentiles
1
100
In which :
Dispersion Dispersion : variability around the central tendency
Range Range : relative simple measure of variability
Range = Maximum value ‐ Minimum value
Time Value of Money
Nominal risk‐free rate / Nominal risk‐free rate = Real risk‐free rate + expected inflation rate
Real risk‐free rate
Required interest rate on a Required interest rate on a securities = Nominal risk‐free rate
security + default risk premium
+ liquidity premium
+ maturity risk premium
Effective annual rate (EAR) 1 1
In which :
FV / PV formula 1 ⁄
1 ⁄
1 ⁄
PV of a perpetuity
⁄
Concepts Description
Discounted Cash Flow Applications
NPV decision rule ‐ (+) NPV → ↑ shareholder wealth → Accept
‐ (‐) NPV → ↓ shareholder wealth → Reject
‐ 2 mutually exclusive projects → Accept project with higher (+) NPV
IRR decision rule ‐ IRR > Firm's required rate of return → Accept
‐ IRR < Firm's required rate of return → Reject
Problems with NPV and IRR Mutually exclusive projects → might have conflict result between NPV and IRR, due to :
‐ Different size of initial costs
‐ Different timing of CF
Holding period return (HPR) Holding period return : % change in investment value over the holding period
(or Holding period yield ‐ HPY)
1
Money‐weighted return / Money weighted return : IRR on a portfolio, taking into account all cash inflows and outflows
Time‐weighted rate of return Time‐weighted rate of return : compound growth
1 1 1 ⋯ 1
Bank discount yield (BDY) Bank discount yield : express the dollar discount from the face (par) value as a fraction of the face value
360
In which :
BDY is not representative of the return earned by an investor, due to :
‐ BDY annualises using simple interest → ignore effects of compound interest
‐ Based on bond's Face value instead of purchase price
‐ BDY annualises on a 360‐day year
Effective annual yield (EAY) Effective annual yield (EAY) : annualised value, based on a 365‐day year, that accounts for compound interest rate
1 / 1
Money market yield (or CD Money market yield (or CD equivalent yield) : annualised holding period yield, assuming a 360‐day year
equivalent yield)
360⁄
360
360
Bond equivalent yield Bond equivalent yield : 2 × semiannual discount rate (because the coupon interest is paid in 2 semiannual payments)
2 1 1
2 1 . 1
Concepts Description
, Statistical Concept and Market Returns
Statistic / Statistic : refer to data and methods used to analyse data
Descriptive statistic / Descriptive statistics : summarise the important characteristics of large data sets
Inferential statistic / Inferential statistics : used to make foreasts, estimates, or judgements about a large data seton the basis of statistical characteristics of a smaller sample set
Population / Population : set of all possible members of a stated group
Sample Sample : subset of the population
Types of measurement scales 4 major categories of measurement scales :
1. Nominal scale ‐ data is put into categories that have no particular order
2. Ordinal scale ‐ data is put into categories that could be ordered based on several characteristic
3. Interval scale ‐ Differences in data values are meaningful, but ratios are not meaningful
4. Ratio scale ‐ Ratios are meaningful ; zero represents the complete absence of the characteristic being measured
Parameter / Parameter : any measurable characteristic of a population
Sample statistic / Sample statistic : characteristic of a sample
Frequency distribution / Frequency distribution : summary of statistical data, by assigning sample data into specific intervals (groups). Procedures to construct a frequency distribution :
Relative frequency / ‐ Step 1 : Define the intervals ‐ Too few intervals → data might be too broadly summarised ; Too many intervals → data might not be summarised enough
Cummulative frequency ‐ Step 2 : Tally (assign) the observations
‐ Step 3 : Count the observations
Relative frequency = Absolute frequency ÷ Total number of observations
Cumulative frequency for an interval = sum of all absolute / relative frequencies for all values ≤ that interval's max value
Histogram / Histogram : bar chart of data that has been grouped into a frequency distribution
Frequency polygon
Frequency polygon :
‐ Horizontal axis : midpoint of each interval
‐ Vertical axis : absolute frequency
‐ Each point is connected with a straight line
Measurement of central tendency Measurement of central tendency : to identify the center, or average, of a data set → used to represent the typical, or expected, value in the data set
: Population mean / Sample mean Arimethic mean : sum of all observation value divided by the number of observations
/ arimethic mean / weighted Population mean : mean of all observed values in the population
mean / geometric mean / ∑
harmonic mean / median / mode
Sample mean : mean of all sample values
∑
Weighted mean :
⋯
Geometrical mean :
⁄
⋯ ⋯
Harmonic mean : used to find the average purchasing price
1
∑
In which :
Median : midpoint of a data set when the data is arranged from smallest to largest
Mode : Value that occurs ost frequently in a data set
‐ Unimodal : 1 value that occurs most frequently
‐ Bimodal : 2 values that occur most frequently
‐ Trimodal : 3 values that occur most frequently
Quartiles / Quartiles ‐ distribution is divided into quarters
Quintiles / Quintiles ‐ distribution is divided into fifth
Deciles / Deciles ‐ distribution is divided into tenth
Percentiles Percentiles ‐ distribution is divided into hundredth (percents)
Formula for the position of the observation at given percentiles
1
100
In which :
Dispersion Dispersion : variability around the central tendency
Range Range : relative simple measure of variability
Range = Maximum value ‐ Minimum value