Introduction to R
The basics of the software and using R to conduct basic statistical
calculations
,Getting started
• R is a command driven program, therefore you need to tell R what
is that you want it to do
• To conduct a data analysis using R you need a data file (containing
data you want to analyse) and a file with an R code (called R script)
• In the R script you will tell R where to find the data file, how you w
R to read the data and the type of statistical analysis you want R to
carry out
• It is this R script that you will save as any analysis you’ve done can
redone by simply rerunning the code
,Getting started
• In your R workspace everything is either an object or a command
• An in important object is the “data frame”
• We need to get R to find the data you want to analyse, read it and then pu
into a “data frame object” (more on this later)
• These commands/functions take arguments which are inputs that
allow us to tell the function what it needs to do. This is placed with
brackets following the command
,Where is my data file?
• The path – this is the location for information on your computer
• You could either enter the path directly into R and it will be able to
find the file or folder or you can go through R to find the file. It is u
to you which you choose
• Keep in mind that mistyping the path is one of the first problems
people encounter when using R
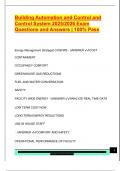
• Finding the path: Windows
,
,
,
,
,
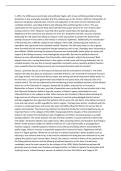
, Where is my data file?
• The path – this is the location for information on your computer
• You could either enter the path directly into R and it will be able to
find the file or folder or you can go through R to find the file. It is u
to you which you choose
• Keep in mind that mistyping the path is one of the first problems
people encounter when using R
• Finding the path: Windows
• Once you have navigated to where your data is stored you can copy the pa
(on Windows 10 it’s the address)
The basics of the software and using R to conduct basic statistical
calculations
,Getting started
• R is a command driven program, therefore you need to tell R what
is that you want it to do
• To conduct a data analysis using R you need a data file (containing
data you want to analyse) and a file with an R code (called R script)
• In the R script you will tell R where to find the data file, how you w
R to read the data and the type of statistical analysis you want R to
carry out
• It is this R script that you will save as any analysis you’ve done can
redone by simply rerunning the code
,Getting started
• In your R workspace everything is either an object or a command
• An in important object is the “data frame”
• We need to get R to find the data you want to analyse, read it and then pu
into a “data frame object” (more on this later)
• These commands/functions take arguments which are inputs that
allow us to tell the function what it needs to do. This is placed with
brackets following the command
,Where is my data file?
• The path – this is the location for information on your computer
• You could either enter the path directly into R and it will be able to
find the file or folder or you can go through R to find the file. It is u
to you which you choose
• Keep in mind that mistyping the path is one of the first problems
people encounter when using R
• Finding the path: Windows
,
,
,
,
,
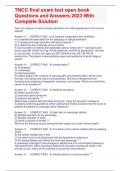
, Where is my data file?
• The path – this is the location for information on your computer
• You could either enter the path directly into R and it will be able to
find the file or folder or you can go through R to find the file. It is u
to you which you choose
• Keep in mind that mistyping the path is one of the first problems
people encounter when using R
• Finding the path: Windows
• Once you have navigated to where your data is stored you can copy the pa
(on Windows 10 it’s the address)