,Chapter 1 Appendix—Working with Graphs
MULTIPLE CHOICE
1. Which type of graph is most frequently used to explain economic concepts?
a. A line graph
b. A bar graph
c. A pie chart
d. Graphs with positive relationships
e. Graphs with negative relationships
ANS: A PTS: 1 DIF: Easy REF: Ch 1, App 1
TOP: Graphs TYP: Factual
2. A pie chart is less useful for explaining economic concepts than a line graph or a bar graph because it
a. is more difficult to read.
b. is time-consuming to draw.
c. does not show the relationship between variables.
d. shows the relationship between too many variables.
e. is merely a picture of a relationship between variables.
ANS: C PTS: 1 DIF: Medium REF: Ch 1, App 1
TOP: Graphs TYP: Factual
3. In a relationship between variables, the value of the dependent variable is determined
a. before the value of the independent variable is determined.
b. after the value of the independent variable is determined.
c. without regard to the value of the independent variable.
d. both before and after the value of the independent variable is determined.
e. at the same time as the value of the independent variable is determined.
ANS: B PTS: 1 DIF: Easy REF: Ch 1, App 1
TOP: Independent and dependent variables TYP: Factual
4. If there is a strong inverse relationship between two variables, it can safely be said that
a. as the value of the independent variable increases, the value of the dependent variable also
increases.
b. as the value of the independent variable increases, the value of the dependent variable
decreases.
c. there is no relationship between the variables.
d. the value of one variable can change and it will have no affect whatsoever on the value of
the other variable.
e. the time value of money is not dependent on interest rates.
ANS: B PTS: 1 DIF: Easy REF: Ch 1, App 1
TOP: Graphs TYP: Factual
© 2011 Cengage Learning. All Rights Reserved. This edition is intended for use outside of the U.S. only, with content that may be different
from the U.S. Edition. May not be scanned, copied, duplicated, or posted to a publicly accessible website, in whole or in part.
, Chapter 1 Appendix 2
5. The text notes that people with a college degree earn more income than people without a college
degree. In this situation,
a. the college degree is the independent variable, and income is the dependent variable.
b. the college degree is the dependent variable, and income is the independent variable.
c. the independent variable is the people without a college degree, and the dependent
variable the people with a college degree.
d. the dependent variable is the people without a college degree, and the independent
variable the people with a college degree
e. there is no independent variable.
ANS: A PTS: 1 DIF: Medium REF: Ch 1, App 1
TOP: Independent and dependent variables TYP: Applied
6. A direct relationship is one for which
a. there is no slope to the curve showing the relationship between variables.
b. there is no dependent variable.
c. there is no independent variable.
d. the dependent and independent variables change in the same direction.
e. the dependent and independent variables change in opposite directions.
ANS: D PTS: 1 DIF: Medium REF: Ch 1, App 1
TOP: Direct relationships TYP: Factual
7. Which of the following best illustrates a direct positive relationship between two variables?
a. The price of gasoline increases 10 cents per gallon, and the quantity of gasoline consumed
falls by 5 percent.
b. Your boss gives you a large bonus, and the price of a hot lunch in the cafeteria doubles.
c. The price of automobiles increases, and manufacturers of automobiles increase their
production of automobiles.
d. A heavy rainstorm drenches the coast of California, and the price of imported Italian shoes
is cut in half.
e. The Green Bay Packers win the Super Bowl, and the stock market moves down 200
points.
ANS: C PTS: 1 DIF: Easy REF: Ch 1, App 1
TOP: Positive relationships TYP: Applied
8. If the number of personal computers purchased depends on the price, and it is known that as the price
of computers falls, the number of computers purchased increases, it can be said that
a. the number of personal computers purchased is the dependent variable.
b. the number of personal computers purchased is the independent variable.
c. both variables are independent.
d. both variables are dependent.
e. the slope of the line could be either positive or negative.
ANS: A PTS: 1 DIF: Easy REF: Ch 1, App 1
TOP: Independent and dependent variables TYP: Factual
© 2011 Cengage Learning. All Rights Reserved. This edition is intended for use outside of the U.S. only, with content that may be different
from the U.S. Edition. May not be scanned, copied, duplicated, or posted to a publicly accessible website, in whole or in part.
, Chapter 1 Appendix 3
9. A relationship in which the value of the dependent variable increases as the value of the independent
variable decreases is
a. a positive relationship.
b. a direct relationship.
c. a ceteris paribus relationship.
d. an inverse relationship.
e. a constant relationship.
ANS: D PTS: 1 DIF: Medium REF: Ch 1, App 1
TOP: Inverse relationships TYP: Factual
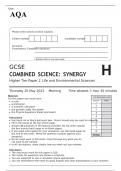
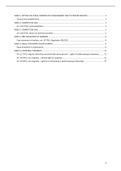
Figure A1-1
10. The inverse relationship of two variables, X and Y, is shown in which graph of Figure A1-1?
a. A
b. C
c. D
d. B
e. None of these
ANS: A PTS: 1 DIF: Easy REF: Ch 1, App 1
TOP: Negative slope TYP: Applied
11. The positive relationship of two variables, X and Y, is shown in which graph of Figure A1-1?
a. B
b. D
c. C
d. A
e. None of these
ANS: A PTS: 1 DIF: Easy REF: Ch 1, App 1
TOP: Positive slope TYP: Applied
© 2011 Cengage Learning. All Rights Reserved. This edition is intended for use outside of the U.S. only, with content that may be different
from the U.S. Edition. May not be scanned, copied, duplicated, or posted to a publicly accessible website, in whole or in part.
MULTIPLE CHOICE
1. Which type of graph is most frequently used to explain economic concepts?
a. A line graph
b. A bar graph
c. A pie chart
d. Graphs with positive relationships
e. Graphs with negative relationships
ANS: A PTS: 1 DIF: Easy REF: Ch 1, App 1
TOP: Graphs TYP: Factual
2. A pie chart is less useful for explaining economic concepts than a line graph or a bar graph because it
a. is more difficult to read.
b. is time-consuming to draw.
c. does not show the relationship between variables.
d. shows the relationship between too many variables.
e. is merely a picture of a relationship between variables.
ANS: C PTS: 1 DIF: Medium REF: Ch 1, App 1
TOP: Graphs TYP: Factual
3. In a relationship between variables, the value of the dependent variable is determined
a. before the value of the independent variable is determined.
b. after the value of the independent variable is determined.
c. without regard to the value of the independent variable.
d. both before and after the value of the independent variable is determined.
e. at the same time as the value of the independent variable is determined.
ANS: B PTS: 1 DIF: Easy REF: Ch 1, App 1
TOP: Independent and dependent variables TYP: Factual
4. If there is a strong inverse relationship between two variables, it can safely be said that
a. as the value of the independent variable increases, the value of the dependent variable also
increases.
b. as the value of the independent variable increases, the value of the dependent variable
decreases.
c. there is no relationship between the variables.
d. the value of one variable can change and it will have no affect whatsoever on the value of
the other variable.
e. the time value of money is not dependent on interest rates.
ANS: B PTS: 1 DIF: Easy REF: Ch 1, App 1
TOP: Graphs TYP: Factual
© 2011 Cengage Learning. All Rights Reserved. This edition is intended for use outside of the U.S. only, with content that may be different
from the U.S. Edition. May not be scanned, copied, duplicated, or posted to a publicly accessible website, in whole or in part.
, Chapter 1 Appendix 2
5. The text notes that people with a college degree earn more income than people without a college
degree. In this situation,
a. the college degree is the independent variable, and income is the dependent variable.
b. the college degree is the dependent variable, and income is the independent variable.
c. the independent variable is the people without a college degree, and the dependent
variable the people with a college degree.
d. the dependent variable is the people without a college degree, and the independent
variable the people with a college degree
e. there is no independent variable.
ANS: A PTS: 1 DIF: Medium REF: Ch 1, App 1
TOP: Independent and dependent variables TYP: Applied
6. A direct relationship is one for which
a. there is no slope to the curve showing the relationship between variables.
b. there is no dependent variable.
c. there is no independent variable.
d. the dependent and independent variables change in the same direction.
e. the dependent and independent variables change in opposite directions.
ANS: D PTS: 1 DIF: Medium REF: Ch 1, App 1
TOP: Direct relationships TYP: Factual
7. Which of the following best illustrates a direct positive relationship between two variables?
a. The price of gasoline increases 10 cents per gallon, and the quantity of gasoline consumed
falls by 5 percent.
b. Your boss gives you a large bonus, and the price of a hot lunch in the cafeteria doubles.
c. The price of automobiles increases, and manufacturers of automobiles increase their
production of automobiles.
d. A heavy rainstorm drenches the coast of California, and the price of imported Italian shoes
is cut in half.
e. The Green Bay Packers win the Super Bowl, and the stock market moves down 200
points.
ANS: C PTS: 1 DIF: Easy REF: Ch 1, App 1
TOP: Positive relationships TYP: Applied
8. If the number of personal computers purchased depends on the price, and it is known that as the price
of computers falls, the number of computers purchased increases, it can be said that
a. the number of personal computers purchased is the dependent variable.
b. the number of personal computers purchased is the independent variable.
c. both variables are independent.
d. both variables are dependent.
e. the slope of the line could be either positive or negative.
ANS: A PTS: 1 DIF: Easy REF: Ch 1, App 1
TOP: Independent and dependent variables TYP: Factual
© 2011 Cengage Learning. All Rights Reserved. This edition is intended for use outside of the U.S. only, with content that may be different
from the U.S. Edition. May not be scanned, copied, duplicated, or posted to a publicly accessible website, in whole or in part.
, Chapter 1 Appendix 3
9. A relationship in which the value of the dependent variable increases as the value of the independent
variable decreases is
a. a positive relationship.
b. a direct relationship.
c. a ceteris paribus relationship.
d. an inverse relationship.
e. a constant relationship.
ANS: D PTS: 1 DIF: Medium REF: Ch 1, App 1
TOP: Inverse relationships TYP: Factual
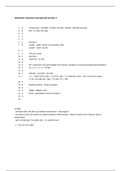
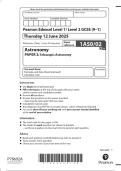
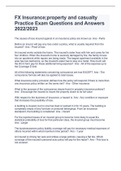
Figure A1-1
10. The inverse relationship of two variables, X and Y, is shown in which graph of Figure A1-1?
a. A
b. C
c. D
d. B
e. None of these
ANS: A PTS: 1 DIF: Easy REF: Ch 1, App 1
TOP: Negative slope TYP: Applied
11. The positive relationship of two variables, X and Y, is shown in which graph of Figure A1-1?
a. B
b. D
c. C
d. A
e. None of these
ANS: A PTS: 1 DIF: Easy REF: Ch 1, App 1
TOP: Positive slope TYP: Applied
© 2011 Cengage Learning. All Rights Reserved. This edition is intended for use outside of the U.S. only, with content that may be different
from the U.S. Edition. May not be scanned, copied, duplicated, or posted to a publicly accessible website, in whole or in part.