Week 1
Introduction
The course
Lectures with pen & paper exercises
Lab sessions
Project days
Grade
50% project (report & code)
50% written exam
Machine learning
Supervised learning => learning relationship (f) between input (x) & output (y)
based on training data
Classification
Regression
Methods for classification
Logistic regr
K nearest neigbours
Linear/quadratic discriminant analysis
Decision trees/ random forest
, Support vector machines
Neural networks
Methods for regression
Linear
Decision trees/ random forest
Neural networks
Unsupervised learning => learning structure in training data without output
variable to predict
Clustering
Structure
Methods for clustering
K means
Expectation maximisation
Hierarchical
Methods for dimensionality reduction
Principal component analysis
How to optimally use training/test data?
, Resampling: cross validation, bootstrapping
Statistical learning (chapter 2)
Statistical learning
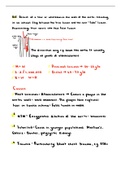
Estimating f
Income = y = response var
Years of education = x = predictor
Unknown relationship between x & y = f
Random error with mean 0 = E
- Part of y not explained by f
- Black bars
Can also be multivariate
More than 2 input dimensions (x)
- Number of input dimensions = p
- Number of data points = n
Prediction
y = f(x) + E
- Y & f usually unknown
- Estimate f to predict y from known x values ^y = ^f (x)
- F estimated using training data
- Error term E
Error of the model
- Estimated from data set = mean squared error
Reducible & irreducible error
- Reducible error => can be reduced by applying more appropriate
learning technique & models, or by adding more training data
- Irreducible error => cannot be reduced because relevant input is
unmeasured or there is unmeasurable variation
Inference
Again estimate f
- But now: understand how x affects y
Prediction vs inference
- Prediction => estimate to get good prediction
, - Inference => estimate to get understanding
Prediction accuracy vs model interpretability
Linear models => high interpretability & sometimes high accuracy
Highly non-linear models => low interpretability, high accuracy c
Choice depends on prediction or inference
- Prediction more likely non-linear
- Inference more likely linear
Parametric vs non-parametric
Parametric
- Choose functional form of f
- Learn parameters of f from training data using least squares or
different method
😊 easier to estimate set of parameters than to fit arbitrary function
less training data needed
☹ if chosen functional form is too far from truth results can be poor
Non-parametric
- No assumptions about functional form of f
- Estimate of f should fit well
😊 potential good fit, even if input-output relations are complex
☹ requires much more training data, risk of overfitting
Supervised & unsupervised
Supervised learning => based on n training examples with p input
dimensions & 1 output (y), fit y = f(x) + E
Unsupervised learning => n training examples with p input dimensions,
no corresponding outputs (y)
- Find structure in data: clustering or dimensionality reduction
Regression & classification
Regression
- Response is quantitative (e.g. numerical)
Classification
- Response is qualitative/categorical
Accuracy of a model
Introduction
The course
Lectures with pen & paper exercises
Lab sessions
Project days
Grade
50% project (report & code)
50% written exam
Machine learning
Supervised learning => learning relationship (f) between input (x) & output (y)
based on training data
Classification
Regression
Methods for classification
Logistic regr
K nearest neigbours
Linear/quadratic discriminant analysis
Decision trees/ random forest
, Support vector machines
Neural networks
Methods for regression
Linear
Decision trees/ random forest
Neural networks
Unsupervised learning => learning structure in training data without output
variable to predict
Clustering
Structure
Methods for clustering
K means
Expectation maximisation
Hierarchical
Methods for dimensionality reduction
Principal component analysis
How to optimally use training/test data?
, Resampling: cross validation, bootstrapping
Statistical learning (chapter 2)
Statistical learning
Estimating f
Income = y = response var
Years of education = x = predictor
Unknown relationship between x & y = f
Random error with mean 0 = E
- Part of y not explained by f
- Black bars
Can also be multivariate
More than 2 input dimensions (x)
- Number of input dimensions = p
- Number of data points = n
Prediction
y = f(x) + E
- Y & f usually unknown
- Estimate f to predict y from known x values ^y = ^f (x)
- F estimated using training data
- Error term E
Error of the model
- Estimated from data set = mean squared error
Reducible & irreducible error
- Reducible error => can be reduced by applying more appropriate
learning technique & models, or by adding more training data
- Irreducible error => cannot be reduced because relevant input is
unmeasured or there is unmeasurable variation
Inference
Again estimate f
- But now: understand how x affects y
Prediction vs inference
- Prediction => estimate to get good prediction
, - Inference => estimate to get understanding
Prediction accuracy vs model interpretability
Linear models => high interpretability & sometimes high accuracy
Highly non-linear models => low interpretability, high accuracy c
Choice depends on prediction or inference
- Prediction more likely non-linear
- Inference more likely linear
Parametric vs non-parametric
Parametric
- Choose functional form of f
- Learn parameters of f from training data using least squares or
different method
😊 easier to estimate set of parameters than to fit arbitrary function
less training data needed
☹ if chosen functional form is too far from truth results can be poor
Non-parametric
- No assumptions about functional form of f
- Estimate of f should fit well
😊 potential good fit, even if input-output relations are complex
☹ requires much more training data, risk of overfitting
Supervised & unsupervised
Supervised learning => based on n training examples with p input
dimensions & 1 output (y), fit y = f(x) + E
Unsupervised learning => n training examples with p input dimensions,
no corresponding outputs (y)
- Find structure in data: clustering or dimensionality reduction
Regression & classification
Regression
- Response is quantitative (e.g. numerical)
Classification
- Response is qualitative/categorical
Accuracy of a model