5PSYC001: Data Analysis for Psychology
Learning journal
Student ID: w1822353
Semester 1 2022/23
, Insert circled
Parts into
results section
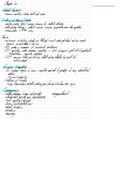
This table displays the results of the analysis of variance (ANOVA) and whether there is a
statistically significant difference between the group means.
Row 1 contains the model residuals and the independent variable. Degrees of freedom (Df)
for both the independent and residual variables are shown. Total squares for each M=mean
group are shown in the sum Sq column. The total squares inside each group add up to 435.30,
whereas those across groupings total just 351.52. To compute the mean square (Sq), divide
the total number of squares by the number of degrees of freedom. The F-Value statistic is the
ratio of the squares of the residuals to the squares of the independent variables. A more
significant F value suggests that the variation in the independent variable is accurate and not
due to chance. The F statistic's p-value may be found in Pr(>F). If there were no difference
between the groups, then the F value of the test would have been. The p-value for the
intergroup type suggests that it substantially impacts typical pedagogical approaches
(p<.001).
Provide an overview of the variables considered and the F-value, degrees of freedom, and
significance level for each independent variable.
Learning journal
Student ID: w1822353
Semester 1 2022/23
, Insert circled
Parts into
results section
This table displays the results of the analysis of variance (ANOVA) and whether there is a
statistically significant difference between the group means.
Row 1 contains the model residuals and the independent variable. Degrees of freedom (Df)
for both the independent and residual variables are shown. Total squares for each M=mean
group are shown in the sum Sq column. The total squares inside each group add up to 435.30,
whereas those across groupings total just 351.52. To compute the mean square (Sq), divide
the total number of squares by the number of degrees of freedom. The F-Value statistic is the
ratio of the squares of the residuals to the squares of the independent variables. A more
significant F value suggests that the variation in the independent variable is accurate and not
due to chance. The F statistic's p-value may be found in Pr(>F). If there were no difference
between the groups, then the F value of the test would have been. The p-value for the
intergroup type suggests that it substantially impacts typical pedagogical approaches
(p<.001).
Provide an overview of the variables considered and the F-value, degrees of freedom, and
significance level for each independent variable.