Hoorcolleges blok 1.4
Lecture 1
Online practice quizzes on bskweb every week available until sunday 23.59 (lijkt op
examen). Aan het einde van de week komen de antwoorden erbij.
Tutorial reports moeten in de template ingevuld worden.
Dit blok veel analyseren en interpreteren van data (stap 5 en 6). Analyseren is wel leuk,
maar als je niet kan interpreteren heb je er niks aan.
2 branches of statistics, we kijken naar allebei.
- Descriptive: beschrijven, organiseren, samenvatten, weergeven, etc.
- Inferential: de macht van statistiek. Je hebt een sample van 100 mensen, maar wat
als je iets over de hele populatie wil zeggen? Met bepaalde technieken de resultaten
van een sample onderzoek of survey ofzo iets zeggen over een grotere populatie.
Sample vs. population
- Het meeste statistische werk is gebaseerd op samples. Bijna alleen CBS heeft geen
inferential statistics nodig.
- Sample: kleine groep drawn from population we are interested in. Sample is bijv. de
studenten in deze collegezaal, population is alle studenten in de studie.
- Als de sample representatief is van de populatie kunnen we ‘informed guesses’
maken over de population gebaseerd op de sample waarde.
- Als een sample randomly selected is, is het vaak representatief.
- Maar, ze zijn nooit perfect representatief, random selection is het beste.
- Samples zijn meestal niet random, dus denk hierover na. Anders krijg je misschien
een verkeerde indruk van de populatie.
,Small world vs. big world.
- Het percentage mannen in de achterste rij kan exact berekend worden. Je kunt tellen
en het uitrekenen.
- Deze proportie is de ‘best guess’ over het percentage mannen in de ‘big room’ (hele
collegezaal). Het is waarschijnlijk niet precies goed.
- When we use small world statistics to make guesses about the big world, there is
always some uncertainty.
Descriptive vs inferential statistics
- Descriptive: summarizing data from a sample. No uncertainty (maar feiten).
- Inferential: making a guess about population values based on your sample. There is
a level of uncertainty.
- Because a sample is never perfectly representative of the population, there is
sampling error. Thus, we always express our uncertainty when using inferential
statistics. Bijv. als je een andere rij stoelen kiest is er waarschijnlijk een ander
percentage mannen.
Later in the course, you will hear terms like standard error and p-value, which are both ways
of expressing uncertainty when using a sample to make guesses about the population.
Random sampling
The best way to minimise sampling error is to have a random sample, where every individual
in the population has an equal chance to be included.
- Our sample of choosing a row was not random.
- Our survey was not a random sample. Mensen die invulden zijn bijv. meer
gemotiveerd. Of mensen die niet invulden waren ziek of checkten email niet etc.
- In real research we almost never have a random sample. We often have
convenience samples, which may be different from the population in some way
(biased).
Causality
Many researchers are interested in questions of causality.
- Statistics do not establish causality.
- Research designs can help establish causality.
Experimental method:
- Randomly assign people to control and experimental group.
- If you find a relationship between group and outcome, you can argue that this
relationship is causal because:
- You randomly assigned people to groups, so there should be no difference at
the beginning.
- Your treated groups differently, so the only difference should be the
treatment.
Descriptive/correlational methods: ‘naturally occurring’ or survey/questionnaire data about
things you’re interested in. You can’t infer causal relationships, but you can still use the data.
- You can use every statistical analysis you want to find interesting/useful
relationships.
1
, - But keep in mind: you can never demonstrate causality. Correlation does not mean
causality.
- Spurious effects appear when two things you measured are both caused by a third
thing, that you didn’t measure. Bijv. mensen die ijs eten worden vaker aangevallen
door haaien. Je hebt het seizoen niet gemeten: in de zomer zwemmen meer mensen
in de zee en eten meer mensen ijs.
Data
If you have a sample you will want to collect some data. In social science, we often talk
about cases and variables to talk about data.
- Cases can be individual people, companies, countries, etc. Depending on unit of
analysis.
- Variables are properties that differ between cases.
- Every individual could be a case, sex/gender and height are two variables.
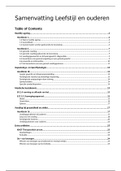
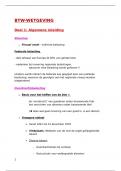
SPSS voorbeeld van survey data:
- Elke rij is van een individuele student → case.
- Kolommen zijn variabelen. Resp.id is een variabele om de cases te labellen.
Levels of measurement (what kind of values does a variable have)
For example, length can take any positive value in centimeters. Your biological sex on the
other hand, can have one of two ‘values’. These distinctions are important.
- Is the variable continuous (many different values) or categorical (groups).
- If you have groups: are these nominal (different only by name), or ordinal (ordered
groups).
- If you have continuous variables, are they at interval level (distance between
measurements is meaningful) or ratio (is there an absolute 0 point).
- On a scale (1-10) is categorical and can be ordered.
Categorical: the variable measures whether a case belongs to one of several categories
- Discrete: the variable takes exact values (whole numbers, text labels).
- It is not possible to fall between categories.
- E.g. sex (male/female), gender, happiness on a 105 scale.
Continuous: variable can take any numerical value
- E.g. temperature, age, etc.
Levels of measurement (NOIR)
● categorical
○ Nominal
- Categorical variables.
- Each category is only different in name, does not correspond to values
or order.
- E.g. male or female.
○ Ordinal
- Ordered categories.
- E.g. low to high, first and second place, etc.
● Continuous
2
, ○ Interval
- Distance is meaningful: a step from 1 to 2 is exactly as ‘far’ as a step
from 2 to 3.
- No true 0-point (in celsius is 0 the freezing point of water, in fahrenheit
is 0 just cold).
○ Ratio
- Same as interval, but with true 0-point.
- The ratio (dividing one bij the other) of values is meaningful. 40 is
twice as much as 20 (not the case with temperature in celsius). 0
actually means something.
- E.g. income, length.
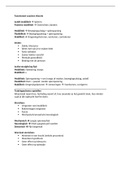
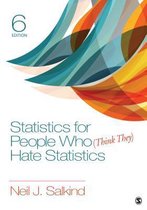
Summarizing data
Imagine that we collected data on the age of a sample of N=40 students in this classroom. It
might look like this.
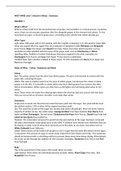
You can’t just dump this on paper an write a report. You need to summarize data.
You could put it in a table using SPSS (analyse - descriptive statistics - frequencies)
3
Lecture 1
Online practice quizzes on bskweb every week available until sunday 23.59 (lijkt op
examen). Aan het einde van de week komen de antwoorden erbij.
Tutorial reports moeten in de template ingevuld worden.
Dit blok veel analyseren en interpreteren van data (stap 5 en 6). Analyseren is wel leuk,
maar als je niet kan interpreteren heb je er niks aan.
2 branches of statistics, we kijken naar allebei.
- Descriptive: beschrijven, organiseren, samenvatten, weergeven, etc.
- Inferential: de macht van statistiek. Je hebt een sample van 100 mensen, maar wat
als je iets over de hele populatie wil zeggen? Met bepaalde technieken de resultaten
van een sample onderzoek of survey ofzo iets zeggen over een grotere populatie.
Sample vs. population
- Het meeste statistische werk is gebaseerd op samples. Bijna alleen CBS heeft geen
inferential statistics nodig.
- Sample: kleine groep drawn from population we are interested in. Sample is bijv. de
studenten in deze collegezaal, population is alle studenten in de studie.
- Als de sample representatief is van de populatie kunnen we ‘informed guesses’
maken over de population gebaseerd op de sample waarde.
- Als een sample randomly selected is, is het vaak representatief.
- Maar, ze zijn nooit perfect representatief, random selection is het beste.
- Samples zijn meestal niet random, dus denk hierover na. Anders krijg je misschien
een verkeerde indruk van de populatie.
,Small world vs. big world.
- Het percentage mannen in de achterste rij kan exact berekend worden. Je kunt tellen
en het uitrekenen.
- Deze proportie is de ‘best guess’ over het percentage mannen in de ‘big room’ (hele
collegezaal). Het is waarschijnlijk niet precies goed.
- When we use small world statistics to make guesses about the big world, there is
always some uncertainty.
Descriptive vs inferential statistics
- Descriptive: summarizing data from a sample. No uncertainty (maar feiten).
- Inferential: making a guess about population values based on your sample. There is
a level of uncertainty.
- Because a sample is never perfectly representative of the population, there is
sampling error. Thus, we always express our uncertainty when using inferential
statistics. Bijv. als je een andere rij stoelen kiest is er waarschijnlijk een ander
percentage mannen.
Later in the course, you will hear terms like standard error and p-value, which are both ways
of expressing uncertainty when using a sample to make guesses about the population.
Random sampling
The best way to minimise sampling error is to have a random sample, where every individual
in the population has an equal chance to be included.
- Our sample of choosing a row was not random.
- Our survey was not a random sample. Mensen die invulden zijn bijv. meer
gemotiveerd. Of mensen die niet invulden waren ziek of checkten email niet etc.
- In real research we almost never have a random sample. We often have
convenience samples, which may be different from the population in some way
(biased).
Causality
Many researchers are interested in questions of causality.
- Statistics do not establish causality.
- Research designs can help establish causality.
Experimental method:
- Randomly assign people to control and experimental group.
- If you find a relationship between group and outcome, you can argue that this
relationship is causal because:
- You randomly assigned people to groups, so there should be no difference at
the beginning.
- Your treated groups differently, so the only difference should be the
treatment.
Descriptive/correlational methods: ‘naturally occurring’ or survey/questionnaire data about
things you’re interested in. You can’t infer causal relationships, but you can still use the data.
- You can use every statistical analysis you want to find interesting/useful
relationships.
1
, - But keep in mind: you can never demonstrate causality. Correlation does not mean
causality.
- Spurious effects appear when two things you measured are both caused by a third
thing, that you didn’t measure. Bijv. mensen die ijs eten worden vaker aangevallen
door haaien. Je hebt het seizoen niet gemeten: in de zomer zwemmen meer mensen
in de zee en eten meer mensen ijs.
Data
If you have a sample you will want to collect some data. In social science, we often talk
about cases and variables to talk about data.
- Cases can be individual people, companies, countries, etc. Depending on unit of
analysis.
- Variables are properties that differ between cases.
- Every individual could be a case, sex/gender and height are two variables.
SPSS voorbeeld van survey data:
- Elke rij is van een individuele student → case.
- Kolommen zijn variabelen. Resp.id is een variabele om de cases te labellen.
Levels of measurement (what kind of values does a variable have)
For example, length can take any positive value in centimeters. Your biological sex on the
other hand, can have one of two ‘values’. These distinctions are important.
- Is the variable continuous (many different values) or categorical (groups).
- If you have groups: are these nominal (different only by name), or ordinal (ordered
groups).
- If you have continuous variables, are they at interval level (distance between
measurements is meaningful) or ratio (is there an absolute 0 point).
- On a scale (1-10) is categorical and can be ordered.
Categorical: the variable measures whether a case belongs to one of several categories
- Discrete: the variable takes exact values (whole numbers, text labels).
- It is not possible to fall between categories.
- E.g. sex (male/female), gender, happiness on a 105 scale.
Continuous: variable can take any numerical value
- E.g. temperature, age, etc.
Levels of measurement (NOIR)
● categorical
○ Nominal
- Categorical variables.
- Each category is only different in name, does not correspond to values
or order.
- E.g. male or female.
○ Ordinal
- Ordered categories.
- E.g. low to high, first and second place, etc.
● Continuous
2
, ○ Interval
- Distance is meaningful: a step from 1 to 2 is exactly as ‘far’ as a step
from 2 to 3.
- No true 0-point (in celsius is 0 the freezing point of water, in fahrenheit
is 0 just cold).
○ Ratio
- Same as interval, but with true 0-point.
- The ratio (dividing one bij the other) of values is meaningful. 40 is
twice as much as 20 (not the case with temperature in celsius). 0
actually means something.
- E.g. income, length.
Summarizing data
Imagine that we collected data on the age of a sample of N=40 students in this classroom. It
might look like this.
You can’t just dump this on paper an write a report. You need to summarize data.
You could put it in a table using SPSS (analyse - descriptive statistics - frequencies)
3