2023-2024, Block 1 GW4003MV. Advanced Research Methods
WEEK 6
Moving beyond the Qualitative /
Quantitative dichotomy
Inhoud
Lecture 6 (6 okt)................................................................................................................................................2
2. Why do quantitative research?.................................................................................................................2
Descriptive research.................................................................................................................................3
1. Description versus 3. Causal inference..................................................................................................3
Predictive research...................................................................................................................................4
2. Prediction versus 3. Causal inference....................................................................................................5
Causal inference research.........................................................................................................................5
*Two perspectives on observational studies................................................................................................6
3. Why do qualitative research?...................................................................................................................7
How do the WG’s relate to a thesis?.........................................................................................................8
4. Qualitative vs. Quantitative research........................................................................................................9
Workgroup meeting 8.....................................................................................................................................11
Homework assignment...............................................................................................................................11
Present: Quantitative case 2...................................................................................................................11
Discuss: Qualitative case 2......................................................................................................................14
Qualitative case 1....................................................................................................................................15
Quantitative case 1.................................................................................................................................16
Literature........................................................................................................................................................17
1
,2023-2024, Block 1 GW4003MV. Advanced Research Methods
Lecture 6 (6 okt)
2. Why do quantitative research?
Slide 14
Slide 16
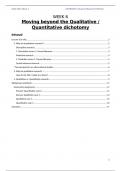
Based on:
Hernan et al. (2019)
A Second Chance to
get causal inference
right: a classification
of data science
tasks.
Slide 18
2
, 2023-2024, Block 1 GW4003MV. Advanced Research Methods
Distinguishing between these 3 reasons makes sense. There are crucial differences in:
- Design
- Statistical methods
- Interpretation of results
- Evaluation
- Role of theory and subject knowledge
Descriptive research
Slide 19 – 26
Goals:
To identify patterns in data
To obtain factual information
1. Description: Design and interpretation
There is a slight difference in using population data or using sample data. Both are summaries of
observations and/or of differences/associations.
If you use population data (e.g., election results) there is no uncertainty.
If you use sample data, there is quantify uncertainty (e.g. using confidents intervals). Technically, null-
hypothsis significance testing can be performed, but this is not very informative (and probably not aligned
with the RQ).
1. Description: Evaluation
Are the results:
Interesting?
Starting point for policy or further (causal) research?
1. Description versus 3. Causal inference
Description: you ruin your analysis by statistical adjustment. The results no longer make sense.
Causal inference: you may ruin your analysis by lack of statistical adjustment. The results are then biased
(confounders).
In the PC labs, we used description to explore the data before running (adjusted) regression analysis
and draw causal inference. The study objective was not description.
3
WEEK 6
Moving beyond the Qualitative /
Quantitative dichotomy
Inhoud
Lecture 6 (6 okt)................................................................................................................................................2
2. Why do quantitative research?.................................................................................................................2
Descriptive research.................................................................................................................................3
1. Description versus 3. Causal inference..................................................................................................3
Predictive research...................................................................................................................................4
2. Prediction versus 3. Causal inference....................................................................................................5
Causal inference research.........................................................................................................................5
*Two perspectives on observational studies................................................................................................6
3. Why do qualitative research?...................................................................................................................7
How do the WG’s relate to a thesis?.........................................................................................................8
4. Qualitative vs. Quantitative research........................................................................................................9
Workgroup meeting 8.....................................................................................................................................11
Homework assignment...............................................................................................................................11
Present: Quantitative case 2...................................................................................................................11
Discuss: Qualitative case 2......................................................................................................................14
Qualitative case 1....................................................................................................................................15
Quantitative case 1.................................................................................................................................16
Literature........................................................................................................................................................17
1
,2023-2024, Block 1 GW4003MV. Advanced Research Methods
Lecture 6 (6 okt)
2. Why do quantitative research?
Slide 14
Slide 16
Based on:
Hernan et al. (2019)
A Second Chance to
get causal inference
right: a classification
of data science
tasks.
Slide 18
2
, 2023-2024, Block 1 GW4003MV. Advanced Research Methods
Distinguishing between these 3 reasons makes sense. There are crucial differences in:
- Design
- Statistical methods
- Interpretation of results
- Evaluation
- Role of theory and subject knowledge
Descriptive research
Slide 19 – 26
Goals:
To identify patterns in data
To obtain factual information
1. Description: Design and interpretation
There is a slight difference in using population data or using sample data. Both are summaries of
observations and/or of differences/associations.
If you use population data (e.g., election results) there is no uncertainty.
If you use sample data, there is quantify uncertainty (e.g. using confidents intervals). Technically, null-
hypothsis significance testing can be performed, but this is not very informative (and probably not aligned
with the RQ).
1. Description: Evaluation
Are the results:
Interesting?
Starting point for policy or further (causal) research?
1. Description versus 3. Causal inference
Description: you ruin your analysis by statistical adjustment. The results no longer make sense.
Causal inference: you may ruin your analysis by lack of statistical adjustment. The results are then biased
(confounders).
In the PC labs, we used description to explore the data before running (adjusted) regression analysis
and draw causal inference. The study objective was not description.
3