Micro Economics: Chapter 4:
Background to Demand
Rational action involves considering the relative costs and benefits to us of the alternatives
we could spend our money on.
Rational consumer A person who weighs up the costs and benefits to him or her of each
additional unit of a good purchased.
‘irrationally’ buy goods impetuously or out of habit.
4.1 Marginal utility theory
Total and marginal utility
Utility is satisfaction you get from buying goods and services.
Total utility The total satisfaction a consumer gets from the consumption of all the units of a
good consumed within a given time period.
Marginal utility The extra satisfaction gained from consuming one extra unit of a good
within a given time period.
Util An imaginary unit of satisfaction from the consumption of a good.
Diminishing marginal utility
The marginal utility falls, the more you consume. This is known as the principle of
diminishing marginal utility.
Diminishing marginal utility As more units of a good are consumed, additional units will
provide less additional satisfaction than previous units.
At some level of consumption, your total utility will be at a maximum. No extra satisfaction
can be gained by the consumption of further units within that period of time.
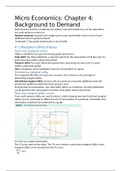
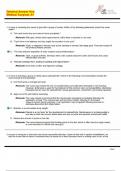
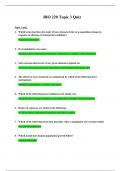
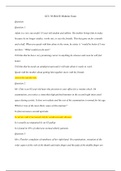
Total and marginal utility curves
If we could measure utility, we could construct a table showing how much total and marginal
utility a person would gain at different levels of consumption of a particular commodity. This
information could then be transferred to a graph.
The MU curve slopes downwards.
The TU curve starts at the origin. The TU curve reaches a peak when marginal utility is zero.
Marginal utility can be derived from the TU curve.
, The ceteris paribus assumption
Each time the consumption of other goods changed – whether substitutes or complements –
a new utility schedule would have to be drawn up. The curves would shift. Remember, utility
is not a property of the goods themselves. Utility is in the mind of the consumer, and
consumers change their minds. Their tastes change; their circumstances change; their
consumption patterns change.
The optimum level of consumption: the simplest case – one
commodity
One solution to the problem is to measure utility with money. In this case, utility becomes
the value that people place on their consumption. Marginal utility thus becomes
the amount of money a person would be prepared to pay to obtain one more unit: in other
words, what that extra unit is worth to that person.
Consumer surplus The excess of what a person would have been prepared to pay for a good
(i.e. the utility) over what that person actually pays.
Marginal consumer surplus
Marginal consumer surplus The excess of utility from the consumption of one more unit of a
good (MU) over the price paid: MCS = MU – P.
Total consumer surplus
Total consumer surplus The excess of a person’s total utility from the consumption of a good
(TU ) over the total amount that person spends on it (TE): TCS = TU − TE.
All the marginal consumer surpluses that you have obtained from all the units of a good you
have consumed.
Rational consumer behaviour The attempt to maximise total consumer surplus.
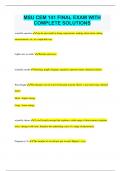
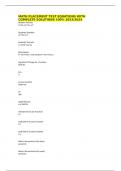
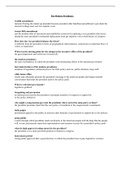
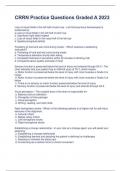
If the price of a commodity is P1, the consumer will consume Q1. The person’s total
expenditure (TE) is P1Q1, shown by area 1. Total utility (TU ) is the area under the marginal
utility curve: i.e. areas 1 + 2. Total consumer surplus (TU − TE) is shown by area 2.
Marginal utility and the demand curve for a good
An individual’s demand curve
Individual people’s demand curve for any good will be the same as their marginal utility
curve for that good, where utility is measured in money.
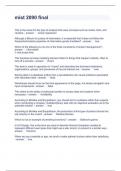
The market demand curve
The market demand curve will simply be the (horizontal) sum of all individuals’ demand
curves and hence MU curves.
Background to Demand
Rational action involves considering the relative costs and benefits to us of the alternatives
we could spend our money on.
Rational consumer A person who weighs up the costs and benefits to him or her of each
additional unit of a good purchased.
‘irrationally’ buy goods impetuously or out of habit.
4.1 Marginal utility theory
Total and marginal utility
Utility is satisfaction you get from buying goods and services.
Total utility The total satisfaction a consumer gets from the consumption of all the units of a
good consumed within a given time period.
Marginal utility The extra satisfaction gained from consuming one extra unit of a good
within a given time period.
Util An imaginary unit of satisfaction from the consumption of a good.
Diminishing marginal utility
The marginal utility falls, the more you consume. This is known as the principle of
diminishing marginal utility.
Diminishing marginal utility As more units of a good are consumed, additional units will
provide less additional satisfaction than previous units.
At some level of consumption, your total utility will be at a maximum. No extra satisfaction
can be gained by the consumption of further units within that period of time.
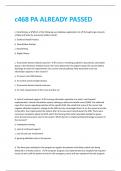
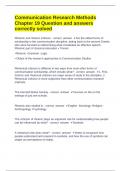
Total and marginal utility curves
If we could measure utility, we could construct a table showing how much total and marginal
utility a person would gain at different levels of consumption of a particular commodity. This
information could then be transferred to a graph.
The MU curve slopes downwards.
The TU curve starts at the origin. The TU curve reaches a peak when marginal utility is zero.
Marginal utility can be derived from the TU curve.
, The ceteris paribus assumption
Each time the consumption of other goods changed – whether substitutes or complements –
a new utility schedule would have to be drawn up. The curves would shift. Remember, utility
is not a property of the goods themselves. Utility is in the mind of the consumer, and
consumers change their minds. Their tastes change; their circumstances change; their
consumption patterns change.
The optimum level of consumption: the simplest case – one
commodity
One solution to the problem is to measure utility with money. In this case, utility becomes
the value that people place on their consumption. Marginal utility thus becomes
the amount of money a person would be prepared to pay to obtain one more unit: in other
words, what that extra unit is worth to that person.
Consumer surplus The excess of what a person would have been prepared to pay for a good
(i.e. the utility) over what that person actually pays.
Marginal consumer surplus
Marginal consumer surplus The excess of utility from the consumption of one more unit of a
good (MU) over the price paid: MCS = MU – P.
Total consumer surplus
Total consumer surplus The excess of a person’s total utility from the consumption of a good
(TU ) over the total amount that person spends on it (TE): TCS = TU − TE.
All the marginal consumer surpluses that you have obtained from all the units of a good you
have consumed.
Rational consumer behaviour The attempt to maximise total consumer surplus.
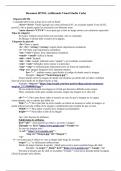
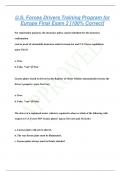
If the price of a commodity is P1, the consumer will consume Q1. The person’s total
expenditure (TE) is P1Q1, shown by area 1. Total utility (TU ) is the area under the marginal
utility curve: i.e. areas 1 + 2. Total consumer surplus (TU − TE) is shown by area 2.
Marginal utility and the demand curve for a good
An individual’s demand curve
Individual people’s demand curve for any good will be the same as their marginal utility
curve for that good, where utility is measured in money.
The market demand curve
The market demand curve will simply be the (horizontal) sum of all individuals’ demand
curves and hence MU curves.