MIDTERM: CHAPTERS 1-9
CHAPTER 1
Market failure: individual pursuit of one’s own interest makes society worse off.
Macroeconomics: overall ups and downs of the economy.
PRINCIPLES:
1. Choices are necessary because resources (things that can be used to produce
something else) are scarce.
2. The true cost of something is its opportunity cost (what you must give up in order to
get it).
3. “How much” is a decision at the margin (marginal decision): decision involves a
trade-off (compare costs and benefits)
4. People usually respond to incentives, exploiting opportunities to make themselves
better off.
5. There are gains from trade: the sum is greater than the parts → specialization!
6. Markets move toward equilibrium, because people respond to incentives.
7. Resources should be used efficiently to achieve society’s goals: efficiently: used in a
way that has fully exploited all opportunities to make everyone better off.
Avoid deadweight loss (with subsidies for example).
8. Markets usually lead to efficiency, because people usually exploit gains from trade:
markets principles seem to work, so many economists are pro laissez-faire.
9. When markets don’t achieve efficiency, government intervention can improve
society’s welfare: act as an external force for economic growth.
10. One person’s spending is another person’s income.
11. Overall spending sometimes gets out of line with the economy’s productive capacity:
spending too low → recession, spending too high → inflation
12. Government policies can change spending
CHAPTER 2
Slope: of a linear curve: 𝚫y/𝚫x.
of a horizontal line: zero.
of a vertical line: infinity.
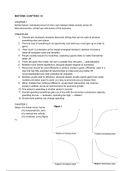
of a nonlinear curve (figure
1).
, CHAPTER 3
Competitive market: many buyers and sellers of the same good/service.
DEMAND:
Demand schedule: shows how much of a good/service consumers will want to buy at
different prices.
Demand curve: graphical representation of demand schedule.
Quantity demanded: actual amount of a good/service consumers are willing to buy at a
specific price (price ↑→ quantity demanded↓, price ↓→ quantity demanded ↑).
Shift of the demand curve: change in quantity demanded at any given price.
- Leftward shift: decrease in demand.
- Rightward shift: increase in demand.
Movement along the demand curve: change in quantity demanded because of price change.
Five principal factors that shift the demand curve:
- Changes in the prices of related goods/services:
● Substitutes: rise in price of one causes increase in demand for the other
(replace each other).
● Complements: rise in price of one causes decrease in demand for the other.
- Changes in income:
● Normal good: rise in income increases demand.
● Inferior good: rise in income decreases demand.
- Changes in tastes.
- Changes in expectations.
- Changes in the number of consumers.
Individual demand curve: shows relationship between quantity demanded and price for an
individual consumer.
SUPPLY:
Supply schedule: shows how much of a good/service would be supplied at different prices.
Supply curve: graphical representation of supply schedule.
Quantity supplied: actual amount of a good/service people are willing to sell at a specific
price.
Shift of the supply curve: change in quantity supplied at any given price.
- Leftward shift: decrease in supply.
- Rightward shift: increase in supply.
Movement along the supply curve: change in quantity supplied because of price change.
Five principal factors that shift the supply curve:
- Changes in input prices.
- Changes in the prices of related goods or services:
● Substitutes.
● Complements.
- Changes in technology (supplying often gets cheaper).
- Changes in expectations.
CHAPTER 1
Market failure: individual pursuit of one’s own interest makes society worse off.
Macroeconomics: overall ups and downs of the economy.
PRINCIPLES:
1. Choices are necessary because resources (things that can be used to produce
something else) are scarce.
2. The true cost of something is its opportunity cost (what you must give up in order to
get it).
3. “How much” is a decision at the margin (marginal decision): decision involves a
trade-off (compare costs and benefits)
4. People usually respond to incentives, exploiting opportunities to make themselves
better off.
5. There are gains from trade: the sum is greater than the parts → specialization!
6. Markets move toward equilibrium, because people respond to incentives.
7. Resources should be used efficiently to achieve society’s goals: efficiently: used in a
way that has fully exploited all opportunities to make everyone better off.
Avoid deadweight loss (with subsidies for example).
8. Markets usually lead to efficiency, because people usually exploit gains from trade:
markets principles seem to work, so many economists are pro laissez-faire.
9. When markets don’t achieve efficiency, government intervention can improve
society’s welfare: act as an external force for economic growth.
10. One person’s spending is another person’s income.
11. Overall spending sometimes gets out of line with the economy’s productive capacity:
spending too low → recession, spending too high → inflation
12. Government policies can change spending
CHAPTER 2
Slope: of a linear curve: 𝚫y/𝚫x.
of a horizontal line: zero.
of a vertical line: infinity.
of a nonlinear curve (figure
1).
, CHAPTER 3
Competitive market: many buyers and sellers of the same good/service.
DEMAND:
Demand schedule: shows how much of a good/service consumers will want to buy at
different prices.
Demand curve: graphical representation of demand schedule.
Quantity demanded: actual amount of a good/service consumers are willing to buy at a
specific price (price ↑→ quantity demanded↓, price ↓→ quantity demanded ↑).
Shift of the demand curve: change in quantity demanded at any given price.
- Leftward shift: decrease in demand.
- Rightward shift: increase in demand.
Movement along the demand curve: change in quantity demanded because of price change.
Five principal factors that shift the demand curve:
- Changes in the prices of related goods/services:
● Substitutes: rise in price of one causes increase in demand for the other
(replace each other).
● Complements: rise in price of one causes decrease in demand for the other.
- Changes in income:
● Normal good: rise in income increases demand.
● Inferior good: rise in income decreases demand.
- Changes in tastes.
- Changes in expectations.
- Changes in the number of consumers.
Individual demand curve: shows relationship between quantity demanded and price for an
individual consumer.
SUPPLY:
Supply schedule: shows how much of a good/service would be supplied at different prices.
Supply curve: graphical representation of supply schedule.
Quantity supplied: actual amount of a good/service people are willing to sell at a specific
price.
Shift of the supply curve: change in quantity supplied at any given price.
- Leftward shift: decrease in supply.
- Rightward shift: increase in supply.
Movement along the supply curve: change in quantity supplied because of price change.
Five principal factors that shift the supply curve:
- Changes in input prices.
- Changes in the prices of related goods or services:
● Substitutes.
● Complements.
- Changes in technology (supplying often gets cheaper).
- Changes in expectations.