Bioinformation technology, SSB-20306
Important points for studying.
Paul Nijhuis
Bsc. Biotechnology 2017
Contents
Lecture 2a – Sequence coverage and sequencing DNA .......................................................................... 2
Lecture 2b – DNA sequencing: assembly, annotation & structural variation detection. ........................ 5
Lecture 3 – proteomics............................................................................................................................ 9
Lecture 4A: Substitution patterns. ........................................................................................................ 15
Lecture 4B: Matrices ............................................................................................................................. 16
Lecture 4C: BIT-scores, P and E-values. ................................................................................................. 17
Lecture 4D: The BLAST algorithm. ......................................................................................................... 20
Lecture ?7?: Protein domains and PSI-BLAST....................................................................................... 21
Lecture 8: Best Bidirectional hit and FAIR (research) ............................................................................ 22
Lecture 8B: FAIR by design. ................................................................................................................... 24
Lecture 9&10: transcript measurement & transcriptomics. ................................................................. 25
Lecture 11: Topological signals.............................................................................................................. 29
Lecture 12: Multiple sequence alignments ........................................................................................... 31
Lecture 13: 3D protein structures. ........................................................................................................ 32
Lecture 14: protein databank (PDB) ...................................................................................................... 36
Lecture 15: Comparative protein structure modelling.......................................................................... 36
Lecture 16: Quality check protein model. ............................................................................................. 39
1|Page
Paul Nijhuis, Wageningen University
,Lecture 2a – Sequence coverage and sequencing DNA
Learning goals
1. Describe and interpret genome characteristics such as
size range, gene content, ploidy and heterozygosity.
2. Describe how genomic data is generated and in what formats it is stored.
FASTA files:
• Readable text files
o Header line, starting with ‘>’, containing read ID
o DNA sequence of the read
FASTQ files:
• Header line, starting with ‘’@’’, containing read ID.
• The next line then indicates the quality header with a ‘’+’’.
• FastQ files also include Phred quality scores for each base (fourth line).
o Based on probability P of incorrect base call: Q= -10 log10(P(incorrect base)).
3. Differentiate between different types of genomic measurements (Sanger,
second and third generation), list their advantages/disadvantages and
associate them with specific problems they yield in mapping and assembly.
First generation sequencing:
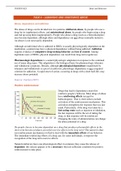
Sanger sequencing: Single-stranded DNA is mixed with a primer and split into four aliquots, each containing DNA
polymerase, four deoxyribonucleotide triphosphates (dNTP’s) and a replication terminator
dideoxyribonucleotide (ddNTP’S). The mixtures are loaded into spare lanes of a gel and electrophoresis is used
to separate DNA fragments. The sequence of the original strand is inferred from the results.
Disadvantage: detection of homopolymers (same nucleotide occurring multiple times) is hard, because the peak
height of the signal decreases the longer the stretch is. This makes it difficult to differentiate between 3, 4 and 5
nucleotides of the same base.
2|Page
Paul Nijhuis, Wageningen University
,Second generation sequencing:
Roche/454 (pyrosequencing)GS-FLX+, Illumina MiSeq, ABI Solid, Illumina Hiseq
Advantage:
-Very high throughput
Disadvantage:
- Shorter reads (35 – 500 bp), but paired (both ends of a single fragment of DNA
-More errors
-PCR-Bias: Regions in the genome with high or very low GC content are less amplified than regions in the genome
with average GC content. Thus genomes with GC maxima in their coding regions will have these regions described
less.
Third generation sequencing:
IonTorrent; Oxford Nanopore
Advantage:
-Longer reads (400 – 30000 bp)
-New readouts (?)
Disadvantage:
-More errors
PacBio (3rd generation)
Advantage:
-No PCR step involved in sequencing process, so there is no *PCR-bias due to high GC content.
-Long read lengths (250- 20.000 bp).
-Gives uniform coverage across a genome sequence.
Disadvantage:
-High error rate, mostly being indels. This gives problems in variant calling and genome assembly.
-Less high throughput than Illumina (2nd gen).
-High price per base.
4. Interpret Phred-scale quality scores and their importance in genomics data
analysis, and describe how quality control algorithms work.
• FASTQ files make use of phred scores. Based on probability P of incorrect base call: Q= -10
log10(P(relative frequency of mismatch)).
o Q = 10; 1 in 10 (10% incorrect)
o Q= 20: 1 in 100 (1.0% incorrect)
o Q=30: 1 in 1000 (0.1% incorrect)
o Q=40: 1 in 10.000 (0.01% incorrect)
o Q values are stored as letters and single (e.g. & * ^ % # @ etc) in FASTQ file
• Quality inspection:
o Most used tools in quality inspection are FASTQC
▪ Per base quality report shows the mean Phred quality of each base position in a read.
For illumine the Phred quality score should be > 30 (0,1% chance of wrong base
incorporation). This visualizes quality drop near the end of the read (3’-end).
Explanation of the read drop phenomena.
▪ The GC distribution over the entire read length is expected to be normally distributed.
If not this may indicate contamination of the sample.
• Pre-Prosessing (can remove 20 – 30% of all reads from the data set!):
o In this case it is better to work with a smaller, but high quality dataset than with a large but
low(er) quality data set.
o Make sure only reliable data is used:
▪ Remove any reads with N’s. N’s are nucleotides which are inserted when the
sequencer has no idea what nucleotide goes there.
3|Page
Paul Nijhuis, Wageningen University
, ▪ Remove (‘’trim’’) adapter sequences from reads.
▪ Remove reads that have become too short. (e.g. 30-50 bp). These reads do not align
very well and lead to confusing results.
▪ Filter for quality, e.g.:
• Trim bases at start or end with low quality (Q<30)
• Remove reads that have become too short
o This is done with Sickle in the assignment. When one of the reads
in a read pair is removed, the other is as well.
5. Discuss how DNA sequence mapping works and how it can be used to detect
both local variation (SNPs, MNPs, indels) and structural variation(translocations, inversions, duplications, copy
number variation).
Key goal: detecting variation:
• SNP’s and MNP’s (small scale variants)
• Align every read to a reference genome.
• Requires only low coverage (at least >10x!), but this makes it harder to find ‘’new’’ genetic material.
• Often used in variant calling.
• In order to detect genetic variation, we should allow for mismatches and gaps
o Problem: computationally harder, so (much) slower
o Errors in reads are always present.
o Short reads no longer map uniquely.
▪ To indicate the probability that a variant is an actual true variants, a phred score is
assigned to the variant.
• This phred quality score takes into account the read depth, mapping quality
(see below) and position of the putative variation.
• Reads that map to multiple locations
o Best for some applications; do not consider these reads.
o Alternatively, keep reads that solely occur at most n times.
• Most used mapping algorithms are BWE and Bowtie
➢ Mapping quality
o Read aligners ofter assign a Phred quality score to an alignment
▪ In reality based on internal criteria about mismatches, indels and alignment length.
▪ For this reason quality scores between different alignment programs cannot be
compared!!!
o Q= -10 log10(p(inaccurate mapping)), as described above this formula is not actually used by
the algorithms.
4|Page
Paul Nijhuis, Wageningen University
Important points for studying.
Paul Nijhuis
Bsc. Biotechnology 2017
Contents
Lecture 2a – Sequence coverage and sequencing DNA .......................................................................... 2
Lecture 2b – DNA sequencing: assembly, annotation & structural variation detection. ........................ 5
Lecture 3 – proteomics............................................................................................................................ 9
Lecture 4A: Substitution patterns. ........................................................................................................ 15
Lecture 4B: Matrices ............................................................................................................................. 16
Lecture 4C: BIT-scores, P and E-values. ................................................................................................. 17
Lecture 4D: The BLAST algorithm. ......................................................................................................... 20
Lecture ?7?: Protein domains and PSI-BLAST....................................................................................... 21
Lecture 8: Best Bidirectional hit and FAIR (research) ............................................................................ 22
Lecture 8B: FAIR by design. ................................................................................................................... 24
Lecture 9&10: transcript measurement & transcriptomics. ................................................................. 25
Lecture 11: Topological signals.............................................................................................................. 29
Lecture 12: Multiple sequence alignments ........................................................................................... 31
Lecture 13: 3D protein structures. ........................................................................................................ 32
Lecture 14: protein databank (PDB) ...................................................................................................... 36
Lecture 15: Comparative protein structure modelling.......................................................................... 36
Lecture 16: Quality check protein model. ............................................................................................. 39
1|Page
Paul Nijhuis, Wageningen University
,Lecture 2a – Sequence coverage and sequencing DNA
Learning goals
1. Describe and interpret genome characteristics such as
size range, gene content, ploidy and heterozygosity.
2. Describe how genomic data is generated and in what formats it is stored.
FASTA files:
• Readable text files
o Header line, starting with ‘>’, containing read ID
o DNA sequence of the read
FASTQ files:
• Header line, starting with ‘’@’’, containing read ID.
• The next line then indicates the quality header with a ‘’+’’.
• FastQ files also include Phred quality scores for each base (fourth line).
o Based on probability P of incorrect base call: Q= -10 log10(P(incorrect base)).
3. Differentiate between different types of genomic measurements (Sanger,
second and third generation), list their advantages/disadvantages and
associate them with specific problems they yield in mapping and assembly.
First generation sequencing:
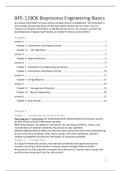
Sanger sequencing: Single-stranded DNA is mixed with a primer and split into four aliquots, each containing DNA
polymerase, four deoxyribonucleotide triphosphates (dNTP’s) and a replication terminator
dideoxyribonucleotide (ddNTP’S). The mixtures are loaded into spare lanes of a gel and electrophoresis is used
to separate DNA fragments. The sequence of the original strand is inferred from the results.
Disadvantage: detection of homopolymers (same nucleotide occurring multiple times) is hard, because the peak
height of the signal decreases the longer the stretch is. This makes it difficult to differentiate between 3, 4 and 5
nucleotides of the same base.
2|Page
Paul Nijhuis, Wageningen University
,Second generation sequencing:
Roche/454 (pyrosequencing)GS-FLX+, Illumina MiSeq, ABI Solid, Illumina Hiseq
Advantage:
-Very high throughput
Disadvantage:
- Shorter reads (35 – 500 bp), but paired (both ends of a single fragment of DNA
-More errors
-PCR-Bias: Regions in the genome with high or very low GC content are less amplified than regions in the genome
with average GC content. Thus genomes with GC maxima in their coding regions will have these regions described
less.
Third generation sequencing:
IonTorrent; Oxford Nanopore
Advantage:
-Longer reads (400 – 30000 bp)
-New readouts (?)
Disadvantage:
-More errors
PacBio (3rd generation)
Advantage:
-No PCR step involved in sequencing process, so there is no *PCR-bias due to high GC content.
-Long read lengths (250- 20.000 bp).
-Gives uniform coverage across a genome sequence.
Disadvantage:
-High error rate, mostly being indels. This gives problems in variant calling and genome assembly.
-Less high throughput than Illumina (2nd gen).
-High price per base.
4. Interpret Phred-scale quality scores and their importance in genomics data
analysis, and describe how quality control algorithms work.
• FASTQ files make use of phred scores. Based on probability P of incorrect base call: Q= -10
log10(P(relative frequency of mismatch)).
o Q = 10; 1 in 10 (10% incorrect)
o Q= 20: 1 in 100 (1.0% incorrect)
o Q=30: 1 in 1000 (0.1% incorrect)
o Q=40: 1 in 10.000 (0.01% incorrect)
o Q values are stored as letters and single (e.g. & * ^ % # @ etc) in FASTQ file
• Quality inspection:
o Most used tools in quality inspection are FASTQC
▪ Per base quality report shows the mean Phred quality of each base position in a read.
For illumine the Phred quality score should be > 30 (0,1% chance of wrong base
incorporation). This visualizes quality drop near the end of the read (3’-end).
Explanation of the read drop phenomena.
▪ The GC distribution over the entire read length is expected to be normally distributed.
If not this may indicate contamination of the sample.
• Pre-Prosessing (can remove 20 – 30% of all reads from the data set!):
o In this case it is better to work with a smaller, but high quality dataset than with a large but
low(er) quality data set.
o Make sure only reliable data is used:
▪ Remove any reads with N’s. N’s are nucleotides which are inserted when the
sequencer has no idea what nucleotide goes there.
3|Page
Paul Nijhuis, Wageningen University
, ▪ Remove (‘’trim’’) adapter sequences from reads.
▪ Remove reads that have become too short. (e.g. 30-50 bp). These reads do not align
very well and lead to confusing results.
▪ Filter for quality, e.g.:
• Trim bases at start or end with low quality (Q<30)
• Remove reads that have become too short
o This is done with Sickle in the assignment. When one of the reads
in a read pair is removed, the other is as well.
5. Discuss how DNA sequence mapping works and how it can be used to detect
both local variation (SNPs, MNPs, indels) and structural variation(translocations, inversions, duplications, copy
number variation).
Key goal: detecting variation:
• SNP’s and MNP’s (small scale variants)
• Align every read to a reference genome.
• Requires only low coverage (at least >10x!), but this makes it harder to find ‘’new’’ genetic material.
• Often used in variant calling.
• In order to detect genetic variation, we should allow for mismatches and gaps
o Problem: computationally harder, so (much) slower
o Errors in reads are always present.
o Short reads no longer map uniquely.
▪ To indicate the probability that a variant is an actual true variants, a phred score is
assigned to the variant.
• This phred quality score takes into account the read depth, mapping quality
(see below) and position of the putative variation.
• Reads that map to multiple locations
o Best for some applications; do not consider these reads.
o Alternatively, keep reads that solely occur at most n times.
• Most used mapping algorithms are BWE and Bowtie
➢ Mapping quality
o Read aligners ofter assign a Phred quality score to an alignment
▪ In reality based on internal criteria about mismatches, indels and alignment length.
▪ For this reason quality scores between different alignment programs cannot be
compared!!!
o Q= -10 log10(p(inaccurate mapping)), as described above this formula is not actually used by
the algorithms.
4|Page
Paul Nijhuis, Wageningen University