2. THE CARTOGRAM: VALUE-BY-AREA MAPPING
We are accustomed to looking at maps on which the political or enumeration units (for example,
states, counties, or census tracts) have been drawn proportional to their geographic area. The
areas on the map are proportional to the geographic areas of the political units. It is quite
possible, however, to prepare maps on which the areas of the enumeration units have been drawn
so that they are proportional to some space other than the geographical. For example, the areas
on the map that represent states can be constructed proportional to their population, aggregate
income, or retail sales volume, rather than their geographic size. Maps on which these different
presentations appear have been called cartograms, value-by-area maps, anamorphated images
and spatial transformations.
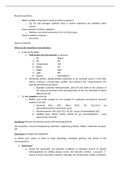
All value-by-area maps, or cartograms, are drawn so that the areas of the internal enumeration
units are proportional to the attribute data they represent, see Figure Cartogram below. In other
thematic forms, data are mapped by selecting a symbol. In the area cartogram, the actual
enumeration unit and its size carry the information.
Value-by-area cartograms can be used to map a variety of data. Currently, some of the more
popular cartogram topics include population totals (the most common), election results, and
epidemiology.
Figure Cartogram
, Forms of Cartograms
Two basic forms of the value-by-area cartogram have emerged: contiguous and noncontiguous.
Each has its own set of advantages and disadvantages, which the designer must weigh in the
context of the map’s purpose.
Contiguous Cartograms
In contiguous cartograms, the internal enumeration units are adjacent to each other. With
contiguity preserved, the reader can more easily make the inference to continuous geographical
space. See Figure Cartogram above for an example of a contiguous cartogram.
Several advantages may be listed for the contiguous form:
1. Boundary and orientation relationships can be maintained, strengthening the link
between the cartogram and true geographical space.
2. The reader need not mentally supply missing areas to complete the total form or
outline of the map.
3. The shape of the total study area is more easily preserved.
The disadvantages of the contiguous form include:
1. Distortion of boundary and orientation relationships can be so great that the link with
true geographical space becomes remote and may confuse the reader.
2. The shapes of the internal enumeration units may be so distorted as to make
recognition almost impossible.
3. Although rapidly changing, the relative lack of dedicated GIS and commercial
software procedures (like a proportional symbol or dot density function from a menu or
list of thematic map choices) makes it more difficult for the cartographer to produce
contiguous cartograms than other thematic map types.
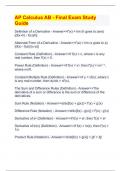
Noncontiguous Cartograms
The noncontiguous cartogram does not preserve boundary relations among the internal
enumeration units. The enumeration units are placed in more or less correct locations relative to
their neighbors, with gaps between them. Such cartograms cannot convey continuous
geographical space and thus require the reader to infer the contiguity feature. See Figure
Noncontiguous Cartogram. Advantages of noncontiguous incudes:
1. They are relatively easy to scale and construct even in software that does not have a
dedicated noncontiguous cartogram procedure.
We are accustomed to looking at maps on which the political or enumeration units (for example,
states, counties, or census tracts) have been drawn proportional to their geographic area. The
areas on the map are proportional to the geographic areas of the political units. It is quite
possible, however, to prepare maps on which the areas of the enumeration units have been drawn
so that they are proportional to some space other than the geographical. For example, the areas
on the map that represent states can be constructed proportional to their population, aggregate
income, or retail sales volume, rather than their geographic size. Maps on which these different
presentations appear have been called cartograms, value-by-area maps, anamorphated images
and spatial transformations.
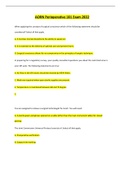
All value-by-area maps, or cartograms, are drawn so that the areas of the internal enumeration
units are proportional to the attribute data they represent, see Figure Cartogram below. In other
thematic forms, data are mapped by selecting a symbol. In the area cartogram, the actual
enumeration unit and its size carry the information.
Value-by-area cartograms can be used to map a variety of data. Currently, some of the more
popular cartogram topics include population totals (the most common), election results, and
epidemiology.
Figure Cartogram
, Forms of Cartograms
Two basic forms of the value-by-area cartogram have emerged: contiguous and noncontiguous.
Each has its own set of advantages and disadvantages, which the designer must weigh in the
context of the map’s purpose.
Contiguous Cartograms
In contiguous cartograms, the internal enumeration units are adjacent to each other. With
contiguity preserved, the reader can more easily make the inference to continuous geographical
space. See Figure Cartogram above for an example of a contiguous cartogram.
Several advantages may be listed for the contiguous form:
1. Boundary and orientation relationships can be maintained, strengthening the link
between the cartogram and true geographical space.
2. The reader need not mentally supply missing areas to complete the total form or
outline of the map.
3. The shape of the total study area is more easily preserved.
The disadvantages of the contiguous form include:
1. Distortion of boundary and orientation relationships can be so great that the link with
true geographical space becomes remote and may confuse the reader.
2. The shapes of the internal enumeration units may be so distorted as to make
recognition almost impossible.
3. Although rapidly changing, the relative lack of dedicated GIS and commercial
software procedures (like a proportional symbol or dot density function from a menu or
list of thematic map choices) makes it more difficult for the cartographer to produce
contiguous cartograms than other thematic map types.
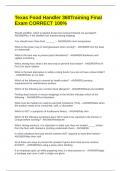
Noncontiguous Cartograms
The noncontiguous cartogram does not preserve boundary relations among the internal
enumeration units. The enumeration units are placed in more or less correct locations relative to
their neighbors, with gaps between them. Such cartograms cannot convey continuous
geographical space and thus require the reader to infer the contiguity feature. See Figure
Noncontiguous Cartogram. Advantages of noncontiguous incudes:
1. They are relatively easy to scale and construct even in software that does not have a
dedicated noncontiguous cartogram procedure.