Presentation of data The sign test Case studies
=
Tables: raw scores displayed in columns and Statistical testing: Studying a ‘case’ provides detailed and in-
rows, summary paragraph of conclusions Significance: difference/association between depth analysis of an individual, group,
Bar charts: bars showing frequency of each two sets of data is greater than would occur by institution or event, they tend to be
category, bars separated chance i.e. it is a meaningful result longitudinal and may involve gathering data
Histograms: bars touch each other, data is Probability: likelihood of something happening, from families and friends as well as the
continuous accepted level I s0.05 (significance level of 0.5) individual.
Scattergrams; used for correlational analysis, the level at which researcher decides to accept - often of unusual individuals or events:
continuous or reject the null hypothesis, might find r/ships someone with a rare disorder
but not certainties - may also concentrate on more ‘typical’
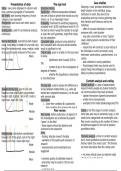
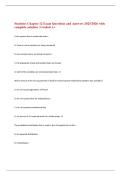
Normal distribution: symmetrical bell-shaped Calculated value: produced using statistical cases: elderly persons recollections of their
curve, most items in middle of curve with very test compared with critical to decide whether childhood
few at the extreme ends, mean, median, mode result is significant or not - researchers will construct a case history of
all occupy the same mid-point of the curve Critical value: given in a table, to find you need the individual or event concerned, using
Mean, to know: interviews, observations, questionnaires, or a
median, mode - significance level (usually 0.05 or combo
5%) - data collected is mainly qualitative
- number of pps in the investigation or - Psychological tests may also be used to
degrees of freedom assess things like intelligence or personality
- whether the hypothesis is directional (likely to produce quantitative)
or non-directional
+ rich,Content analysis
detailed insight, and coding
increases validity as
The sign test: used to analyse the difference in Content analysis is a type of observational
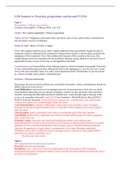
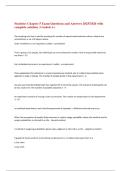
Skewed distributions: lean to one side scores between related items, e.g., same pp research where people are studied indirectly
Negative skew: distribution concentrated tested twice (repeated measures), can be used via communications they have produced
towards right of graph, tail on left, mode is with nominal data - spoken interactions (speech/conversation)
right most, mean left most Calculation: - written forms (texts/emails)
Mode 1. Score from condition B is subtracted - examples from media (books/magazines/TV)
from condition A to produce the sign of
Median Peer review Coding is the first stage of content analysis;
Peer review: before publication, all aspects of some data sets may be extremely large, so info
Mean the investigation are scrutinised by experts needs to be categorised into meaningful units.
(‘peers’) in the field May involve counting up the number of times a
- these experts should be objective and word/phrase appears in the text to produce
unknown to the researcher quantitative data.
Positive skew: distribution concentrated Aims:
towards left of the graph, tail on the right, - funding: allocate research funding Thematic analysis: similar to content analysis
mode is left most, mean right most - validation of the quality and relevance of but is more qualitative and aims to produce
Mode research themes rather than 'word count’. The themes
- improvements and amendments are are more descriptive than the coding units
Median suggested
+ not many ethical issues as material might
Mean + protects quality of published research already be in public domain
- anonymity may be used to criticise rival
research
- publication bias
, reliability statistics Probability and significance
- a measure of consistency, if repeated and get statistical tests are used to determine whether If the statistical test is not significant the null
same results it is reliable. a difference or association/correlation found in hypothesis is accepted, it states there is no
a particular investigation is statistically difference or no correlation between conditions.
Ways of assessing reliability: significant (whether the result occurred by The statistical test determines which
Test-retest: the same test given to same chance or real effect) hypothesis is true and so we accept/reject
person on two or more occasions, if the test is - Probability is a measure of the likelihood that
reliable results should be the same each time level of measurement: a particular event will occur, where 0 is a
Inter-observer: two or more observers compare nominal data: data put into categories, each statistical impossibility and 1 is statistical
their data by conducting pilot study to check item can only go into 1 category, no order, certainty
observers are applying behavioural categories often a tally, can be presented as bar chart - there are no statistical certainties in
in the same way, watch same event but record ordinal data: data that is ordered on numerical psychology but there is a significance level –
data independently scale, no equal intervals as based on subjective the point at which null hypothesis is
Correlation: in test-retest and inter-observer, opinion accepted/rejected
the two sets of scores are correlated. The interval data: standardised measurement units,
correlation co-efficient should exceed +.8 for equal intervals between each unit, represents (See the sign test notes)
reliability things that are set in stone that the researcher
cannot manipulate Type errors:
Improving reliability: Type I errors: null hypothesis is rejected and
Questionnaires: re-write questions and replace choosing a statistical test: alternative accepted when the null is actually
open questions with closed fixed choice 1. Looking for a difference or a true, A FALSE POSITIVE
alternatives which may be less ambiguous correlation/association? - more likely to be made if signif level
validity 2. Is experimental design related (repeated is too high (0.1/10%)
- is the result legitimate? And represent the measures) or unrelated (independent Type II errors: null hypothesis accepted but
real world? measures) alternative is true, pessimistic error or a FALSE
- data can be reliable but not valid 3. What is the level of measurement NEGATIVE
- more likely if signif level is too low
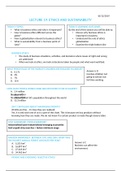
Ways of assessing validity: Unrelated Related Test of (0.01/1%) as potentially significant values may
Face validity: does a test look like it measures design design associatio be missed
(independen (repeated n or
what it is supposed to, done by ‘eyeballing’ the
t measures) measures) correlation
measuring instrument, or getting expert to
Nominal Chi-squared Sign test Chi-
check data squared
Concurrent validity new intelligence test may Ordinal Mann wilcoxen Spearman
be done on pps, scores then compared with data whitney s rho
performance of well-established test Interval Unrelated t- Related t- Pearson r
(correlation = 0.8 for v) data test test
Improving validity:
Questionnaires: lie scales control for social
desirability bias, assured all data submitted is
confidential
Observations: well defined, operationalised
behavioural categories
Experiments: control group increases internal
validity, standardised procedures and
single/double blind minimise impact of pp
=
Tables: raw scores displayed in columns and Statistical testing: Studying a ‘case’ provides detailed and in-
rows, summary paragraph of conclusions Significance: difference/association between depth analysis of an individual, group,
Bar charts: bars showing frequency of each two sets of data is greater than would occur by institution or event, they tend to be
category, bars separated chance i.e. it is a meaningful result longitudinal and may involve gathering data
Histograms: bars touch each other, data is Probability: likelihood of something happening, from families and friends as well as the
continuous accepted level I s0.05 (significance level of 0.5) individual.
Scattergrams; used for correlational analysis, the level at which researcher decides to accept - often of unusual individuals or events:
continuous or reject the null hypothesis, might find r/ships someone with a rare disorder
but not certainties - may also concentrate on more ‘typical’
Normal distribution: symmetrical bell-shaped Calculated value: produced using statistical cases: elderly persons recollections of their
curve, most items in middle of curve with very test compared with critical to decide whether childhood
few at the extreme ends, mean, median, mode result is significant or not - researchers will construct a case history of
all occupy the same mid-point of the curve Critical value: given in a table, to find you need the individual or event concerned, using
Mean, to know: interviews, observations, questionnaires, or a
median, mode - significance level (usually 0.05 or combo
5%) - data collected is mainly qualitative
- number of pps in the investigation or - Psychological tests may also be used to
degrees of freedom assess things like intelligence or personality
- whether the hypothesis is directional (likely to produce quantitative)
or non-directional
+ rich,Content analysis
detailed insight, and coding
increases validity as
The sign test: used to analyse the difference in Content analysis is a type of observational
Skewed distributions: lean to one side scores between related items, e.g., same pp research where people are studied indirectly
Negative skew: distribution concentrated tested twice (repeated measures), can be used via communications they have produced
towards right of graph, tail on left, mode is with nominal data - spoken interactions (speech/conversation)
right most, mean left most Calculation: - written forms (texts/emails)
Mode 1. Score from condition B is subtracted - examples from media (books/magazines/TV)
from condition A to produce the sign of
Median Peer review Coding is the first stage of content analysis;
Peer review: before publication, all aspects of some data sets may be extremely large, so info
Mean the investigation are scrutinised by experts needs to be categorised into meaningful units.
(‘peers’) in the field May involve counting up the number of times a
- these experts should be objective and word/phrase appears in the text to produce
unknown to the researcher quantitative data.
Positive skew: distribution concentrated Aims:
towards left of the graph, tail on the right, - funding: allocate research funding Thematic analysis: similar to content analysis
mode is left most, mean right most - validation of the quality and relevance of but is more qualitative and aims to produce
Mode research themes rather than 'word count’. The themes
- improvements and amendments are are more descriptive than the coding units
Median suggested
+ not many ethical issues as material might
Mean + protects quality of published research already be in public domain
- anonymity may be used to criticise rival
research
- publication bias
, reliability statistics Probability and significance
- a measure of consistency, if repeated and get statistical tests are used to determine whether If the statistical test is not significant the null
same results it is reliable. a difference or association/correlation found in hypothesis is accepted, it states there is no
a particular investigation is statistically difference or no correlation between conditions.
Ways of assessing reliability: significant (whether the result occurred by The statistical test determines which
Test-retest: the same test given to same chance or real effect) hypothesis is true and so we accept/reject
person on two or more occasions, if the test is - Probability is a measure of the likelihood that
reliable results should be the same each time level of measurement: a particular event will occur, where 0 is a
Inter-observer: two or more observers compare nominal data: data put into categories, each statistical impossibility and 1 is statistical
their data by conducting pilot study to check item can only go into 1 category, no order, certainty
observers are applying behavioural categories often a tally, can be presented as bar chart - there are no statistical certainties in
in the same way, watch same event but record ordinal data: data that is ordered on numerical psychology but there is a significance level –
data independently scale, no equal intervals as based on subjective the point at which null hypothesis is
Correlation: in test-retest and inter-observer, opinion accepted/rejected
the two sets of scores are correlated. The interval data: standardised measurement units,
correlation co-efficient should exceed +.8 for equal intervals between each unit, represents (See the sign test notes)
reliability things that are set in stone that the researcher
cannot manipulate Type errors:
Improving reliability: Type I errors: null hypothesis is rejected and
Questionnaires: re-write questions and replace choosing a statistical test: alternative accepted when the null is actually
open questions with closed fixed choice 1. Looking for a difference or a true, A FALSE POSITIVE
alternatives which may be less ambiguous correlation/association? - more likely to be made if signif level
validity 2. Is experimental design related (repeated is too high (0.1/10%)
- is the result legitimate? And represent the measures) or unrelated (independent Type II errors: null hypothesis accepted but
real world? measures) alternative is true, pessimistic error or a FALSE
- data can be reliable but not valid 3. What is the level of measurement NEGATIVE
- more likely if signif level is too low
Ways of assessing validity: Unrelated Related Test of (0.01/1%) as potentially significant values may
Face validity: does a test look like it measures design design associatio be missed
(independen (repeated n or
what it is supposed to, done by ‘eyeballing’ the
t measures) measures) correlation
measuring instrument, or getting expert to
Nominal Chi-squared Sign test Chi-
check data squared
Concurrent validity new intelligence test may Ordinal Mann wilcoxen Spearman
be done on pps, scores then compared with data whitney s rho
performance of well-established test Interval Unrelated t- Related t- Pearson r
(correlation = 0.8 for v) data test test
Improving validity:
Questionnaires: lie scales control for social
desirability bias, assured all data submitted is
confidential
Observations: well defined, operationalised
behavioural categories
Experiments: control group increases internal
validity, standardised procedures and
single/double blind minimise impact of pp