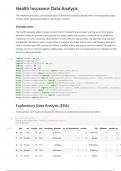
Health Insurance Data Analysis
This notebook provides a structured analysis of the health insurance dataset. We'll cover Exploratory Data
Analysis (EDA), Regression Analysis, Classification Analysis.
Introduction:
The health insurance industry plays a pivotal role in the healthcare ecosystem, acting as an intermediary
between healthcare providers and patients. Accurately predicting insurance claims can be of paramount
importance to such companies, allowing them to set premiums appropriately, manage risks, and maintain
profitability. The dataset under scrutiny offers a snapshot of various factors that could influence insurance
claims, including age, BMI, number of children, smoking habits, and regular exercise routines. Through this
analysis, we aim to uncover patterns, relationships, and insights that can guide insurance companies in their
decision-making processes.
In [1]: import pandas as pd
import numpy as np
import matplotlib.pyplot as plt
import seaborn as sns
import xgboost as xgb
from sklearn.model_selection import train_test_split
from sklearn.tree import DecisionTreeRegressor
from sklearn.ensemble import RandomForestRegressor, GradientBoostingRegressor
from sklearn.metrics import mean_squared_error, mean_absolute_error, mean_squared_log_er
from sklearn.preprocessing import StandardScaler
from sklearn.linear_model import LinearRegression, LogisticRegression
from sklearn.model_selection import RandomizedSearchCV
from sklearn.metrics import mean_absolute_error, mean_squared_error, r2_score, accuracy_
from sklearn.tree import DecisionTreeClassifier
from sklearn.ensemble import RandomForestClassifier
from sklearn.preprocessing import LabelEncoder
from sklearn import metrics
Exploratory Data Analysis (EDA)
In this section, we'll explore the dataset's distributions, relationships, and potential outliers.
In [2]: # Load the data
data = pd.read_csv('health_insurance.csv')
data.head()
Out[2]: age sex weight bmi hereditary_diseases no_of_dependents smoker city diabetes regular_ex
0 60 male 64 24.3 NoDisease 1 0 NewYork 0 0
1 49 female 75 22.6 NoDisease 1 0 Boston 1 1
2 32 female 64 17.8 Epilepsy 2 1 Phildelphia 1 1 A
3 61 female 53 36.4 NoDisease 1 1 Pittsburg 1 0
4 19 female 50 20.6 NoDisease 0 0 Buffalo 1 0 H
, In [3]: # Distribution of key variables
fig, ax = plt.subplots(1, 3, figsize=(20, 5))
sns.histplot(data['claim'], ax=ax[0], kde=True)
ax[0].set_title('Distribution of Claim Amounts')
sns.histplot(data['bmi'], ax=ax[1], kde=True)
ax[1].set_title('Distribution of BMI')
sns.histplot(data['age'], ax=ax[2], kde=True)
ax[2].set_title('Distribution of Age')
plt.tight_layout()
plt.show()
# Correlation heatmap
correlation_matrix = data.corr()
plt.figure(figsize=(12, 8))
sns.heatmap(correlation_matrix, annot=True, cmap='coolwarm', linewidths=0.5)
plt.title('Correlation Heatmap')
plt.show()
# Boxplots for key variables
fig, ax = plt.subplots(1, 3, figsize=(20, 5))
sns.boxplot(y=data['claim'], ax=ax[0])
ax[0].set_title('Boxplot of Claim Amounts')
sns.boxplot(y=data['bmi'], ax=ax[1])
ax[1].set_title('Boxplot of BMI')
sns.boxplot(y=data['age'], ax=ax[2])
ax[2].set_title('Boxplot of Age')
plt.tight_layout()
plt.show()
C:\Users\ttgmo\AppData\Local\Temp\ipykernel_9896\3467862294.py:17: FutureWarning: The de
fault value of numeric_only in DataFrame.corr is deprecated. In a future version, it wil
l default to False. Select only valid columns or specify the value of numeric_only to si
lence this warning.
correlation_matrix = data.corr()