HUMAN INHERITANCE AND
PREDICTING GENETIC
TRAITS.
INTRODUCTION.
In terms of genetics, a trait refers to a unique quality about a person.
Genes, the environment, or a mix of the two may all influence traits.
Qualitative traits like eye colour and quantitative traits are both possible
like height or a person's Blood pressure. Part of a person's whole
phenotype is a particular characteristic. There are both behavioural and
physical traits. A person's mix of a few specific traits may provide us with
hints on how to identify a medical issue. And we can also investigate the
potential connections between various diseases by comparing those
qualities to comparable combinations of traits in many other individuals.
Factors, which are now known as genes, are handed down to offspring and
control how each trait is inherited. Each parent contributes one factor to
an individual's genetic makeup. Although a characteristic may not
manifest in a person, it can nonetheless be passed on to the following
generation.
DIHYBRID AND MONOHYBRID PRACTICAL AND ANALYSIS.
Introduction: If both parents of the F1 generation only vary in one
characteristic, the offspring is said to be a monohybrid cross. An F1
generation cross that results in offspring with two different phenotypes is
known as a dihybrid cross. A monohybrid cross's anticipated phenotypic
ratio is 3:1. The dihybrid cross's anticipated phenotypic ratio is 9:3:3:31.
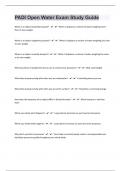
Chi-Square Distribution Table.
p- 0.9 0.9 0.9 0.9 0.9 0. 0. 0. 0. 0. 0.0 0.0 0.0 0.0 0.0
valu 99 95 90 75 50 90 75 50 25 10 5 25 1 05 01
e
Deg
ree
of
free
dom
1 0.0 0.0 0.0 0.0 0.0 0.0 0.1 0.4 1.3 2.7 3.8 5.0 6.6 7.8 10.
00 00 00 01 04 16 02 55 23 06 41 24 35 79 828
,2 0.0 0.0 0.0 0.0 0.1 0.2 0.5 1.3 2.7 4.6 5.9 7.3 9.2 10. 13.
02 10 20 51 03 11 75 86 73 05 91 78 10 597 816
3 0.0 0.0 0.1 0.2 0.3 0.5 1.2 2.3 4.1 6.2 7.8 9.3 11. 12. 16.
24 72 15 16 52 84 13 66 08 51 15 48 345 838 266
4 0.0 0.2 0.2 0.4 0.7 1.0 1.9 3.3 5.3 7.7 9.4 11. 13. 14. 18.
91 07 97 84 11 64 23 57 85 79 88 143 277 860 467
5 0.2 0.4 0.5 0.8 1.1 1.6 2.6 4.3 6.6 9.2 11. 12. 15. 16. 20.
10 12 54 31 45 10 75 51 27 36 070 833 086 750 515
METHODS:
- First, I log onto https://cgslab.com/genetics/index.html?234199 the
CGS (classical genetic simulator) webpage.
- Then after logging in there will be two sections shown, showing
Monohybrid and Dihybrid Crossing.
- First, I go onto the monohybrid section and click on it, then it shows
me different fly types, there are two traits for Fly body type being
Bithorax and Mono-thorax. There are also male and female flies with
different genotypes.
- So randomly I then start crossing male and female flies with
different genotypes to get at least 5 random crossing in 5 vials.
- Then I select only one of the vials, which in this case, I took vial 3,
where the male and female parent crossed were having the
genotype aa, and so the crossing produces 24 flies.
- Then I go onto stats after clicking onto the 3rd vial and a page opens
showing ratios and traits to analyse option, making sure that the
traits to analyse is on body type. I then wrote down 3:1 in the
expected ratio and calculate to get a chi-square and degree of
freedom value. I make a note to write down all the data displayed
on this page.
- There is also a show distribution tab on the screen which shows the
chi-square distribution table. I can then go to degree of freedom 1
and p-value 0.05 and write down my critical value which is 3.841
and compare it with the chi-square calculated value to accept or
reject the null hypothesis.
- Then I close the distribution table and open another tab on the page
that says, ‘View all data’ and here all the flies in each vials crossed
are displayed with their phenotypes and below ratios of each vial
along with parents crossed are given.
- I go onto the 3rd vial and take the data given for that vial.
- Once I have taken all the necessary data, I save the data and then
go onto save/exit. Then I go onto dihybrid crossing and again here I
do random crossing of mice instead, male and female mice and had
7 vials. I selected the 7th vial and then went to stats and then
selected the traits to analyse to tail and vision, and then wrote down
, the expected ratio to 9:3:3:1 and then calculated to get the chi-
square and other required data and again noted it down.
- Then on the chi-square distribution table I go to degree of freedom 3
and p-value 0.05 and note down the critical value to be 7.815.
- Then I go onto the view all data section and then write down the
necessary information from the vial I have chosen. And then save
the data.
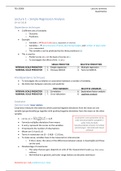
Monohybrid Phenotypic Ratio and Investigation.
Vial 3: 24 Flies (50 - 73)
Female Parent: Fly 34 (Vial 2) - Bithorax(aa)
Male Parent: Fly 33 (Vial 2) - Bithorax(aa)
Body Type F M Total
Bithorax 13 11 24
Monothorax 0 0 0
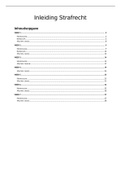
BODY TYPE TRAIT:
Cross: Fly #34 (female) with Fly #33 (male) --> Vial #3
Null Hypothesis = Monothorax trait is autosomal dominant trait. And so
the expected offspring’s will all be Bithorax (aa). There is no significant
difference between the two variables.
Body Type = Bithorax : Monothorax
Expected Ratio = 3 : 1
Observed Numbers = 24 : 0
Expected Numbers = 18.0 : 6.0
Chi-Squared Value = 8.000
Degree of freedom = 1
P Value = 0.05
So, 8.000 is bigger than the critical value of 3.841.
So, the null hypothesis is rejected.
Chi-Square Manual Calculation:
Degree of Freedom = 2-1 = 1
PREDICTING GENETIC
TRAITS.
INTRODUCTION.
In terms of genetics, a trait refers to a unique quality about a person.
Genes, the environment, or a mix of the two may all influence traits.
Qualitative traits like eye colour and quantitative traits are both possible
like height or a person's Blood pressure. Part of a person's whole
phenotype is a particular characteristic. There are both behavioural and
physical traits. A person's mix of a few specific traits may provide us with
hints on how to identify a medical issue. And we can also investigate the
potential connections between various diseases by comparing those
qualities to comparable combinations of traits in many other individuals.
Factors, which are now known as genes, are handed down to offspring and
control how each trait is inherited. Each parent contributes one factor to
an individual's genetic makeup. Although a characteristic may not
manifest in a person, it can nonetheless be passed on to the following
generation.
DIHYBRID AND MONOHYBRID PRACTICAL AND ANALYSIS.
Introduction: If both parents of the F1 generation only vary in one
characteristic, the offspring is said to be a monohybrid cross. An F1
generation cross that results in offspring with two different phenotypes is
known as a dihybrid cross. A monohybrid cross's anticipated phenotypic
ratio is 3:1. The dihybrid cross's anticipated phenotypic ratio is 9:3:3:31.
Chi-Square Distribution Table.
p- 0.9 0.9 0.9 0.9 0.9 0. 0. 0. 0. 0. 0.0 0.0 0.0 0.0 0.0
valu 99 95 90 75 50 90 75 50 25 10 5 25 1 05 01
e
Deg
ree
of
free
dom
1 0.0 0.0 0.0 0.0 0.0 0.0 0.1 0.4 1.3 2.7 3.8 5.0 6.6 7.8 10.
00 00 00 01 04 16 02 55 23 06 41 24 35 79 828
,2 0.0 0.0 0.0 0.0 0.1 0.2 0.5 1.3 2.7 4.6 5.9 7.3 9.2 10. 13.
02 10 20 51 03 11 75 86 73 05 91 78 10 597 816
3 0.0 0.0 0.1 0.2 0.3 0.5 1.2 2.3 4.1 6.2 7.8 9.3 11. 12. 16.
24 72 15 16 52 84 13 66 08 51 15 48 345 838 266
4 0.0 0.2 0.2 0.4 0.7 1.0 1.9 3.3 5.3 7.7 9.4 11. 13. 14. 18.
91 07 97 84 11 64 23 57 85 79 88 143 277 860 467
5 0.2 0.4 0.5 0.8 1.1 1.6 2.6 4.3 6.6 9.2 11. 12. 15. 16. 20.
10 12 54 31 45 10 75 51 27 36 070 833 086 750 515
METHODS:
- First, I log onto https://cgslab.com/genetics/index.html?234199 the
CGS (classical genetic simulator) webpage.
- Then after logging in there will be two sections shown, showing
Monohybrid and Dihybrid Crossing.
- First, I go onto the monohybrid section and click on it, then it shows
me different fly types, there are two traits for Fly body type being
Bithorax and Mono-thorax. There are also male and female flies with
different genotypes.
- So randomly I then start crossing male and female flies with
different genotypes to get at least 5 random crossing in 5 vials.
- Then I select only one of the vials, which in this case, I took vial 3,
where the male and female parent crossed were having the
genotype aa, and so the crossing produces 24 flies.
- Then I go onto stats after clicking onto the 3rd vial and a page opens
showing ratios and traits to analyse option, making sure that the
traits to analyse is on body type. I then wrote down 3:1 in the
expected ratio and calculate to get a chi-square and degree of
freedom value. I make a note to write down all the data displayed
on this page.
- There is also a show distribution tab on the screen which shows the
chi-square distribution table. I can then go to degree of freedom 1
and p-value 0.05 and write down my critical value which is 3.841
and compare it with the chi-square calculated value to accept or
reject the null hypothesis.
- Then I close the distribution table and open another tab on the page
that says, ‘View all data’ and here all the flies in each vials crossed
are displayed with their phenotypes and below ratios of each vial
along with parents crossed are given.
- I go onto the 3rd vial and take the data given for that vial.
- Once I have taken all the necessary data, I save the data and then
go onto save/exit. Then I go onto dihybrid crossing and again here I
do random crossing of mice instead, male and female mice and had
7 vials. I selected the 7th vial and then went to stats and then
selected the traits to analyse to tail and vision, and then wrote down
, the expected ratio to 9:3:3:1 and then calculated to get the chi-
square and other required data and again noted it down.
- Then on the chi-square distribution table I go to degree of freedom 3
and p-value 0.05 and note down the critical value to be 7.815.
- Then I go onto the view all data section and then write down the
necessary information from the vial I have chosen. And then save
the data.
Monohybrid Phenotypic Ratio and Investigation.
Vial 3: 24 Flies (50 - 73)
Female Parent: Fly 34 (Vial 2) - Bithorax(aa)
Male Parent: Fly 33 (Vial 2) - Bithorax(aa)
Body Type F M Total
Bithorax 13 11 24
Monothorax 0 0 0
BODY TYPE TRAIT:
Cross: Fly #34 (female) with Fly #33 (male) --> Vial #3
Null Hypothesis = Monothorax trait is autosomal dominant trait. And so
the expected offspring’s will all be Bithorax (aa). There is no significant
difference between the two variables.
Body Type = Bithorax : Monothorax
Expected Ratio = 3 : 1
Observed Numbers = 24 : 0
Expected Numbers = 18.0 : 6.0
Chi-Squared Value = 8.000
Degree of freedom = 1
P Value = 0.05
So, 8.000 is bigger than the critical value of 3.841.
So, the null hypothesis is rejected.
Chi-Square Manual Calculation:
Degree of Freedom = 2-1 = 1