Rania El Ghalbzouri - IBTB
Microeconomics Summary
L1 - Economics and opportunity cost
“Economics”
Refers to a Greek word for management of a household, i.e.
• who works and how much?
• what and how many goods must be produced
• what means must be used for this production.
• at what price do we sell the goods?
• how do we share revenues
We all have a role in the economy.
• as consumer when we buy something
• as employee when we work for a wage
• as investor when we buy shares or study (Human capital)
• as entrepreneur, financer, prosumer, regulator, policy maker …
We all contribute to the complex systems of supply and demand. Economists study these
complex systems.
Economics = Making Choices
Economics is about making choices.
We make all kinds of choices every day. How much should I spend on electricity? Should I invest
in solar panels or not? What’s the best route to work? Where should we go for dinner? Or
something which is closer to your world: Which job or career should I go for? What are the pros
and cons of finishing college versus taking a job?
Many people hear the word “economics” and think it is all about money. Economics is not just
about money. It is about weighing different choices or alternatives.
Some of those important choices involve money, but most do not!
Most of your daily, monthly, or life choices have nothing to do with money, yet they are still the
subject of economics. For example, your decisions about whether it should be you or your
roommate who should be the one to clean up or do the dishes, whether you should spend an
hour a week volunteering for a charity organization or send them a little money via your cell
phone, or whether you should take a job so you can help support your brothers & sisters or
parents or save for your future are all economic decisions.
In many cases, money is merely a helpful tool, standing in for a partial way to evaluate some
of the goals you really care about and how you make choices about those goals.
You might also think economics is all about “economizing” or being efficient–not making
foolish or wasteful choices about how you spend or budget your time and money. That is
certainly part of what economics is about. However, that’s just the tip of the iceberg. We all
know that we can save money or time by being more efficient in our planning. A trip to the
supermarket can be coordinated with a trip to take your child to school or to deposit a check
at the bank across the street to save on fuel. But we sometimes don’t choose the most efficient
options.
Why not? Economics is also about finding out why we sometimes do and sometimes don’t
make what seem like the most economizing or economical choices.
1
, Rania El Ghalbzouri - IBTB
That you can’t have everything you want the moment you want it is a fact of life. Figuring out
how individuals, families, communities and countries might best handle this to their benefit is
fundamental to what economics is about!
Two Base Economic Concepts
These are perhaps the two most basic economic concepts: scarcity and opportunity cost.
At the heart of economics lies the fact that we cannot have everything that we want.
Because of this we have to make choices and choosing to do one thing is always
accompanied by an implicit choice not to do something else.
The scarcity of money and time can be expanded to include nearly every aspect of one's life.
Scarcity means there is a limited supply or resources. This forces people to choose how much
money to spend on things, how much time should be allocated to an activity, and how much
one's labour is worth.
You are probably used to thinking of natural resources such as titanium, oil, coal, gold and
diamonds as scarce. In fact, they are sometimes called “scarce resources” just to re-emphasize
their limited availability. Everyone agrees natural resources are scarce because they take a lot
of effort, money, time or other resources to get. Or because there seems to be a finite amount
available.
But sometimes it doesn’t matter if something is finite, especially if we can easily substitute
something else. It all depends on your circumstances. Most people don’t think of water as
scarce, but if you live in a desert, water is scarce. If you are a teenager or at high school,
smartphones or the hottest sneakers or the recognition of your peers or a person of interest are
as scarce–as difficult to acquire–as gold.
In fact, economists view everything people want, strive for, or can’t achieve effortlessly as
scarce.
Making Choices
Society cannot accommodate all needs because resources are scarce. This requires ‘good
management’ (cf. definition of economics).
You may have heard the expression "there's no such thing as a free lunch“. This means that in
order to receive something, something must be spent. For example, imagine you go to the
local supermarket and you see a table that offers free ice cream. Is this really free? You have
to walk over the table, spend some time interacting with the server, and then eat the ice
cream. You have spent time and effort that could have been used to do or acquire something
else. This is an opportunity cost or trade-off.
Every choice has an opportunity cost. To get something, we need to give something else up.
• Individually: class or sleep, gym or gaming, food or clothes, spare time vs. income
• Society: guns vs. Butter, efficiency vs. Equality and justice.
• A trade-off occurs.
Opportunity Costs
Opportunity cost or ‘alternative cost of something’ is.
• What you have to give up getting something
• The non-realized benefit of the best possible alternative to the choice made.
2
, Rania El Ghalbzouri - IBTB
Introduction to Economics
When economists refer to the “opportunity cost” of a resource, they mean the value of the
next-highest-valued alternative use of that resource. If, for example, you spend time and
money going to a movie, you cannot spend that time at home reading a book, and you can’t
spend the money on something else. If your next-best alternative to seeing the movie is reading
the book, then the opportunity cost of seeing the movie is the money spent plus the pleasure
you miss by not reading the book….
During my class you all could avoid opportunity cost by multitasking. You could scan you
Facebook account or you can text your friends or work on a paper for another class. So it might
seem that you are using time that has no opportunity cost! But this is wrong! Students doing this
will frequently miss details or instructions because they are only partially tuned in. The
opportunity cost of the multi-tasking attempt is the lost understanding that you could have
gained had you focused your attention on the Economics class.
L1 - Models in Economics
Micro vs. Macro Definitions
It should be clear by now that economics covers a lot of ground. That ground can be divided
into two parts:
• microeconomics focuses on the actions of individual agents within the economy, like
households, workers, and businesses. So, one actor!
• macroeconomics looks at the economy as a whole. So, millions of actors. It focuses
on broad issues such as growth, unemployment, inflation and trade balance.
Microeconomics and macroeconomics are not separate subjects but are rather
complementary perspectives on the overall subject of the economy.
Both approaches are useful, and both researchers study the same lake, but the viewpoints are
different. In a similar way, both microeconomics and macroeconomics study the same
economy, but each has a different starting point, perspective, and focus.
Macroeconomists might look at the larger ecosystem in this image, while a microeconomist
would focus on specific features. The micro and the macro insights should illuminate
each other. In studying a lake, the “micro” insights about particular plants and animals help us
to understand the overall food chain, while the “macro” insights about the overall food chain
help to explain the environment in which individual plants and animals live.
In economics, the micro decisions of individual businesses are influenced by the health of the
macroeconomy—for example, firms will be more likely to hire workers if the overall economy is
growing. In turn, the performance of the macroeconomy ultimately depends on the
microeconomic decisions made by individual households and businesses.
Microeconomics: What determines how households and individuals spend their budgets?
What combination of goods and services will best fit their needs and wants, given the budget
they have to spend? How do people decide whether to work, and if so, whether to work full
time or part time? How do people decide how much to save for the future, or whether they
should borrow to spend beyond their current means?
What determines the products, and how many of each, a firm will produce and sell? What
determines what prices a firm will charge? What determines how a firm will produce its
products? What determines how many workers it will hire? How will a firm finance its business?
3
, Rania El Ghalbzouri - IBTB
When will a firm decide to expand, downsize, or even close? In the microeconomic part of this
text, we will learn about the theory of consumer behaviour and the theory of the firm.
Macroeconomics: What determines the level of economic activity in a society or nation? —
that is, how many goods and services does it actually produce? What determines how many
jobs are available in an economy? What determines a nation’s standard of living? What causes
the economy to speed up or slow down? What causes firms to hire more workers or lay them
off? Finally, what causes the economy to grow over the long term?
An economy’s macroeconomic health can be assessed by a number of standards or goals.
The most important macroeconomic goals are the following:
• Growth in the standard of living
• Low unemployment
• Low inflation
Micro VS Macro
Microeconomics involves:
• Supply and demand in individual markets.
• And the effect this mechanism has on the price of a good or service.
• Individual labour markets – e.g., demand for labour, wage determination
• Individual consumer behaviour. e.g., Consumer choice theory
Macroeconomics involves:
• Economic growth expressed in GDP.
• Reasons for inflation and unemployment
• The total amount of demand in an economy is the aggregate demand*
• The maximum output capacity of an economy is the productive capacity.
• Monetary / fiscal policy. e.g., what effect does interest rates have on the whole economy?
• International trade and globalisation
• Reasons for differences in living standards and economic growth between countries.
• Government borrowing
*Aggregate demand is an economic measurement of the total amount of demand for all
finished goods and services produced in an economy. Aggregate demand is expressed as the
total amount of money exchanged for those goods and services at a specific price level and
point in time.
Economist in both micro- and macroeconomics are using simplifications or making assumptions
or predictions to express everything in math!
And this is valuable since it can clarify your thinking. And you can visualize things with charts
and graphs. But at the same time, it can be dangerous because you make these simplifications
in microeconomics or you make assumptions based on millions of interactions of individuals in
macroeconomics. And this is something you have to keep in mind, Economics seems to be a
science like Physics, but it isn’t! It is open to subjectivity! So, it is important to take it with a grain
of salt. So please be always focused on the true intuition. So, the most important thing to get
from a course of Economics is to truly reason through what is likely going to happen.
Economists like Models
Science
• Observes the complex real world.
• Builds abstract models and theories to help explain observations (induction)
4
, Rania El Ghalbzouri - IBTB
• Uses these models to make predictions and hypotheses (deduction)
• Collects and analyses data to test theories and adjust the model (induction)
Models are Simplifications.
Models are a simplification of reality, an abstraction.
• We use ‘assumptions’ to make the world more comprehensible.
➢ Are these assumptions always, correct? Absolutely not.
Much used simplifying assumption in economics:
• Ceteris paribus: 'all other things being unchanged or constant'
• Man is rational and acts in his self-interest.
• Firms maximize profits.
• Buyers and sellers have perfect information (e.g., the use, quality and cost of a product).
Economic models
Economists use models to better understand the world.
Two very simple economic models
• Production Possibility Frontier
• Circular Flow diagram
5
, Rania El Ghalbzouri - IBTB
L: A simple model: Production possibilities
Model 1: Production Possibilities
Production possibilities frontier:
• A graph which relates the amounts of different goods that can be produced in the
economy.
• Given: the available resources (inputs)
• Given: the state of technology
• Production possibilities frontier- a graph which relates the amounts of different goods that
can be produced in a fully employed society. It shows many concepts like:
➢ Scarcity and choice
➢ The opportunity cost.
➢ Efficiency (Pareto-efficient)
➢ Heterogeneity in inputs
➢ Efficiency ≠ justice/equality
➢ Effect of increases in productivity
➢ Sources of economic growth
• Model- a simplification of the real world that can be manipulated to explain the real world.
• Simplifying assumption- an assumption that may, on its face, be silly but allows for a clearer
explanation.
PPF when people/inputs are heterogenous.
A Production Possibility Frontier (PPF) is a graph that
shows the maximum possible combinations of two goods
that can be produced by an economy given its
resources and technology. In contrast to a homogenous
PPF, a heterogenous PPF assumes that the resources
used to produce the two goods are not interchangeable
and that there is an opportunity cost associated with
switching between them.
For example, consider an economy that can produce
two goods: apples and oranges. The resources required
to produce apples are different from those required to produce oranges. This means that
producing more apples may require a greater sacrifice of oranges than producing a small
quantity of apples. In other words, the opportunity cost of producing apples will increase as the
economy produces more and more apples, leading to a non-linear PPF.
As the economy moves along the PPF, it faces increasing opportunity costs because it must
use progressively less-efficient resources to produce additional units of a good. This results in a
trade-off between producing one good versus the other. The PPF will be a curve, rather than
a straight line, because the slope of the curve changes as we move along it. The curve
becomes steeper as we move from one end of the PPF to the other, indicating the increasing
opportunity cost of producing additional units of one good at the expense of the other. This
concave shape of the PPF reflects the diminishing returns to resources and technology in the
production of the two goods.
6
, Rania El Ghalbzouri - IBTB
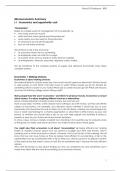
Pareto Efficiency
Pareto efficiency, or Pareto optimality, is an economic
state where resources cannot be reallocated to make
one individual better off without making at least one
individual worse off. Summarized you get this type of
curve when there is a changing opportunity cost.
PPF when people/inputs are homogenous.
A Production Possibility Frontier (PPF) is a graph that
represents the maximum amount of two goods that can
be produced using all available resources and
technology. A homogenous PPF assumes that the
resources and technology used to produce the goods are
identical and can be easily switched from one good to
another without any extra cost.
When a PPF is homogenous, it implies that the opportunity
cost of producing one good is constant and does not
change regardless of the level of production. This means
that the slope of the PPF remains constant, which makes it a straight line.
For example, let's assume that an economy can produce two goods: computers and cars. If
the PPF is homogenous, it means that the same resources and technology can be used to
produce both computers and cars. Therefore, the opportunity cost of producing one unit of a
computer will always be the same as the opportunity cost of producing one unit of a car.
If the economy decides to produce more computers, it will have to give up some production
of cars, and vice versa. However, the trade-off between producing computers and cars will
always be the same, which implies that the slope of the PPF remains constant and the graph is
a straight line..
Heterogenous vs Homogenous Production Possibility Frontier
A homogenous Production Possibility Frontier (PPF) assumes that resources and technology
used to produce goods are interchangeable, resulting in a straight-line PPF. In contrast, a
heterogenous PPF assumes that resources and technology are not interchangeable, leading
to a curved PPF with varying opportunity costs of producing goods.
7
, Rania El Ghalbzouri - IBTB
Example: PPF & Opportunity Cost
In this example, we explore the limits of
production for rabbits and berries, given
limited resources. All points within the curve
represent attainable levels of production,
while those outside are unattainable. Points
on the curve are the most efficient use of
resources. Opportunity cost is the cost of
giving up one option to pursue another, and
it increases as production increases in this
example. The negative slope of the curve
increases as we move down from scenario F,
representing the increasing opportunity cost.
Full explanation:
In this particular example, we are measuring the daily output of rabbits and berries that we can
achieve. However, our productivity is limited by time and our physical abilities, such as speed,
reflexes, and strength.
Attainable = Levels of production that are possible with the given resources
The area within the curve represents the feasible range of output levels, meaning that they can
be achieved with the given resources. However, not all points within this area are optimal or
efficient. For instance, if we are only catching one rabbit and gathering 200 berries, we are not
fully utilizing our resources. This situation is also known as "unemployment," which refers to any
instance where resources are not being used to their full potential, not just limited to joblessness.
Unemployment = A situation that occurs when resources are not fully utilized
The term "unemployment" has a different meaning to economists than it does to most people.
While many associate it with the inability to find work, economists use the term to describe any
underutilization of resources, including capital.
Unattainable = Levels of production that are not possible with the given resources
All points on the curve are efficient, meaning that they represent the maximum output that
can be achieved with the given resources. However, we should not compare the efficiency of
different points on the curve since they are all equally efficient. Points outside the curve are
unattainable and cannot be achieved with the current resources available.
Suppose you find yourself in a scenario where you can hunt rabbits and collect berries. In
Scenario E, if you want to acquire one more rabbit and you already have 280 berries, you
cannot keep all the berries because it would lead you to an impossible situation. As a result,
you must give up 40 berries and be left with only 240 berries. The cost of acquiring one more
rabbit is 40 berries, which is known as the opportunity cost or marginal cost of one rabbit. If you
want to collect 20 more berries, you must sacrifice one rabbit, making the opportunity cost of
20 berries equal to one rabbit. Although the curve is not linear, you can estimate the marginal
cost of one berry by dividing one rabbit by 20, as the curve approaches linearity at the end.
In Scenario F, let's assume you want one more rabbit than you currently have. The opportunity
cost for this is 20 berries. However, if you catch two rabbits instead of one, the opportunity cost
rises to 40 berries. As you continue to catch more rabbits, the opportunity cost increases. This is
known as increasing opportunity cost, which is a common characteristic in most economic
models. However, this model only considers two variables. In Scenario F, you have decided to
collect as many berries as possible, even the ones that are hidden behind bushes and thorns,
8
, Rania El Ghalbzouri - IBTB
and avoid hunting rabbits altogether. But you eventually decide to catch a nearby rabbit that
is easy to get, costing you only a small amount of time and berries. Then, you go after a rabbit
that is a bit quicker and harder to catch, requiring more time and berries. This pattern continues
until you are trying to catch the quickest and smartest rabbits, and you are no longer picking
the low-hanging fruit of berries. The slope of the tangent line in the bow-shaped curve is
negative and increases as you move down from Scenario F, as it is the case in every such curve.
Changing opportunity cost
The shape of opportunity cost can vary depending on the situation. In the case of gathering
berries and catching rabbits, Figure A displays a constant opportunity cost where giving up a
certain amount of berries results in catching a fixed number of rabbits. Figure B illustrates an
increasing opportunity cost, where the more rabbits caught, the more berries must be given
up. On the other hand, Figure C represents a decreasing opportunity cost, where as the
number of rabbits caught increases, the number of berries given up decreases due to
increased efficiency in rabbit-catching skills.
Sources of Economic Growth
• Increase in the availability of resources.
• Increase in the ability of resources to produce goods & services.
In terms of productive capacity of a society, economic growth results from either an increase
in the availability of resources or an increase in the ability of resources to produce goods and
services. (So, in the latter you get better in using the resources!)
In the first case, a newly discovered source of energy, or a source of energy that had, under
previous technology, not been exploitable would constitute a newly available resource.
9
, Rania El Ghalbzouri - IBTB
Reaching not that far back in our history, having women enter the labour force in large
numbers during the 1960s through the 1990s increased the availability of labour.
In the second case, sometimes the resources remain the same but the ability to utilize them to
produce goods and services increases. For instance, when computers and lasers are added to
sawmills, the same logs, saw blades, and labour can produce more lumber. That is, technology
makes resources more productive. Similarly, education makes labour more productive and can
be a source of generalized growth in capacity.
Economic Growth
Generalized Growth: an increase in, or an increase in the ability of resources to produce all
goods.
Specialized Growth: an increase in the ability to produce a particular good because there is
an increase in, or an increase in the ability of resources to produce a particular good.
L1: Model 2: Circular Flow
Model 2: Circular Flow
The economy = a system
• Natural balance between production and consumption
Circular Flow Model: a model that shows the interactions of all economic actors.
• Markets are where the interactions take place.
• Actors are the entities interacting.
• The model shows money and real flows between the economic actors on markets.
Now that we have looked at our first “simplified” model (the one of Opportunity Cost) of the
economy, it’s time to get an idea of the “Big Picture.” On the next page, we will draw up a
circular flow diagram and use it as our road map to the course. This circular flow diagram is
designed to put all of the pieces that follow in perspective. It has firms, workers, investors,
savers, buyers, and sellers all interacting in markets and dealing with government. It has
humanity taking natural resources from the environment, combining them with domestic and
foreign financial and human resources to produce goods and services, and then buying and
selling those goods and services in domestic and foreign markets.
10