Samenvatting
Summary Week 3
Beoordeling
Verkocht
-
Pagina's
2
Geüpload op
15-07-2023
Geschreven in
2022/2023
The text is Mastering Spark with R. After installing the dplyr library, use the following code in R studio, create a scatter plot of hp v. mpg cars2 - copy_to(sc, mtcars) cars3 - (cars2) cars4 - select(cars3, hp, mpg) cars5 - sample_n(cars4, 32) cars6 - collect(cars5) plot(cars6)
Meer zien
Lees minder
Instelling
Big Data Tools & Architecture
Vak
Big Data Tools & Architecture
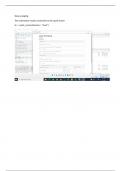
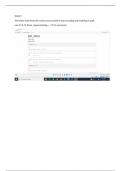
Oeps! We kunnen je document nu niet laden. Probeer het nog eens of neem contact op met support.
Gekoppeld boek
Geschreven voor
- Instelling
- Big Data Tools & Architecture
- Vak
- Big Data Tools & Architecture
Documentinformatie
- Heel boek samengevat?
- Nee
- Wat is er van het boek samengevat?
- Onbekend
- Geüpload op
- 15 juli 2023
- Bestand laatst geupdate op
- 22 februari 2024
- Aantal pagina's
- 2
- Geschreven in
- 2022/2023
- Type
- SAMENVATTING
Onderwerpen
$10.99
Krijg toegang tot het volledige document:
Verkeerd document? Gratis ruilen
Binnen 14 dagen na aankoop en voor het downloaden kun je een ander document kiezen. Je kunt het bedrag gewoon opnieuw besteden.
Geschreven door studenten die geslaagd zijn
Direct beschikbaar na je betaling
Online lezen of als PDF