Summary Introduction to Research in Marketing Measurement scales
• Nonmetric scales • Metric scales
o Nominal o Internal
Lecture 1. Introductory Lecture o Ordinal o Ratio
Statistical tests exist to support strategic and tactical marketing decisions like for example Nominal scale
segmentation, targeting, positioning and to guide the 4 marketing mix decisions (product, • Characteristics: unique definition/identification classification
price, distribution, and communication). This are some examples of marketing research • Phenomena: e.g. brand name, gender, student ANR
problems: • Appropriate methods of analysis/statistics: e.g. %, mode, chi square tests
• Mars Pet Food (segmentation and targeting): What types of ‘pet food shoppers’
can we distinguish, and how can we optimally market our products to them? Example shampoo brand identification:
• Campagnolo Sportswear, Villa Pardoes, Esprit (image/competitive positioning): • Palmolive 1
What is our brand image relative to competitors? • Fructis 2
• Dela, Brain Wash, T-Mobile (optimal “product package”): How can we optimize • Albert Heijn 3
our ‘product package?
• Albert Heijn (impact of local promotion ads): How effective are local promotion The numbers identify the brands. You can classify but you cannot conduct calculations like
ads at increasing store traffic and sales? an average ANR-number. It is especially useful to create insights in a target group, like for
• Intermaché, Leclerc (effectiveness click&collect formats and in-store displays): example a percentage of students who …, or the preferences for particular brands. You
Which type of click-and-collect is most likely to increase chain traffic and are able to create crosstabs with a chi square test like the influence of gender on a chosen
spending. brand. You can only do percentages, modes or look for links between multiple variables.
• Fietsenwinkel.nl: Which types of keywords are most likely used (and generate Ordinal scale
the highest ad impressions) on which types of devices? • Characteristics: indicate order, sequence
• Phenomena: e.g. preference ranking, level of education
1.1 Introduction • Appropriate methods of analysis/statistics: e.g. percentiles, median, rank
Defining Multivariate analysis correlation, and all previous statistics
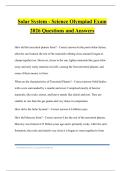
‘Broadly speaking, it refers to all statistical methods that simultaneously analyze multiple
measurements on each individual or object under investigation.’ Example shampoo brand preference:
Why bother? • Albert Heijn • Fructis • Palmolive
• Almost every real life marketing problem requires statistical analysis of several 3 2 1
variables: you need them in your toolkit. For data or facts to support decisions. Example shopping frequency
• Crucial for master thesis Category
o Translate marketing problem Daily 1 >6
o Collect data and analyze data using SPSS 2 to 5 times a week 2 3,5
Some basic concepts Once a week 3 1
Every two weeks 4 0,5
• Measurement scales
Less than twice a month 5 <0,5
• Errors: reliability and validity
• Statistical significance and power
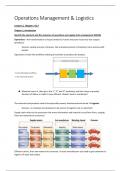
To measure some things, we need measurement scales. Depending on the scale you could An ordinal scale is often used to make an order like most favorable or least preference>
do various actions with the data and methods you choose. Metric scales are for You can calculate the median and percentiles like 10% above … and 90% under … There is
calculations and the nonmetric scales aren’t suitable for that. Scales are important no numeric value because you cannot calculate with ordinal scales. What you can do is to
look for an average number and calculate with that. The last row in the above table is
because you can sometimes not use or transform particular scales, decide before you use
translated to the shopping frequency per week.
a method.
Made by Evita Schippers
, Interval scale With reliability you want to know if there are measurement errors in the outcome, and
• Characteristics: arbitrary origin you will end up the next time with the same results. When that is not the case there could
• Phenomena: e.g. attribute score, price index be something wrong with the measurement. Validity means that you measure what you
• Appropriate methods of analysis/statistics: e.g. arithmetic average, range, are supposed to measure. Even if data is reliable, it may be not valid. Reliability is
standard deviation, product-moment correlation, and previous methods necessary for validity.
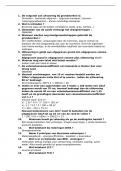
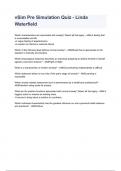
Statistical significance and power
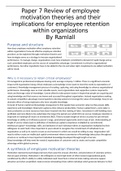
Example shampoo brand quality score: Reality
• Palmolive 95 H0: No difference Ha: Difference
Statistical
decision
• Fructis 90 H0: No difference 1-α β (type II error)
• Albert Heijn 49 Ha: Difference α (type I error) 1-β (power)
Besides an order, there is an indication of difference in brand quality. You can calculate We measure a subset or sample of the population so there is more chance of errors, also
the nominal average, lowest –highest score, and the normal Pearson Correlation errors during measuring data. Type 1 error means that there is no difference in reality, but
coefficient. There is no (natural) zero point, it is a relative measure because it has an the test concludes there is a difference. Type 2 error means there is a difference but you
arbitrary origin that is fixed by the researcher. The difference in degree of preference is conclude there is not a difference. You would like to have 1-α or 1-β (power). You need a
different between the brands. But you cannot say Palmolive is twice more preferred, cutoff to make sure you don’t have a large type 1 error.
that’s because the point is arbitrary. Hypothesis testing (ctd)
Ratio Scale • Type 1 error (α) is that the probability of the test is showing statistical
• Characteristics: unique origin significance when it is not present (false positive).
• Phenomena: e.g. age, cost, number of customers • Power (1-β) is that the probability of the test is showing statistical significance
• Appropriate methods of analysis/statistics: e.g. geometric average, coefficient of when it is present.
variation, and all previous methods Suppose that the truth is “no difference”, what
would error-free population measure lead to? You
Example shampoo brand price: will seldom observe all (fe)male students, you work
• Palmolive €0.81 with a sample, and work with a measurement error.
• Fructis €1.82 Even if you will measure and observe, you cannot
• Albert Heijn €1.40 say there is (no) difference. In safety margin we
conclude that it’s only positive as the measurement
You can you in here extra methods, but they’re not widely used in practice. What you can is higher than a cutoff, this has to be determined. If you increase the cutoff (reduce
calculate for instance is the coefficient of variation and mean. Here you can say that probability that you decide difference whether there is not), you increase the chance on a
Fructis is twice more expensive as Palmolive. type 2 error.
Errors: Reliability and validity Power
• Reliability: Is the measure consistent, correctly registered? • Power depends on α (+), effect size (+), and sample size n (+)
• Validity: Does the measure capture the concept it is supposed to measure? • Implications
o Anticipate consequences of α, effect and n
For example, income. What is your income level? Has to be more specified like before or o Assess/incorporate power when interpreting results.
after taxes, together or alone, from work or extra activities, monthly or yearly? Not If you allow a to go up, there is a bigger chance for power (it’s the same as making the cut
specifying leads to problems with lack of reliability. Do you want to know if they are off lower or going to the left), only when you can live with a bigger chance of risk. Power
financially healthy or wealthy? Is it a perfect measure for someone’s wealthy? No, is the probability that you decided there is difference and in fact there is a difference.
because they could also be rich because of a heritage, that is validity. When effect goes up, it means the bigger the difference, the higher effect size and also
more power. A bigger sample size ensures a higher reliability and less plagued by errors in
the measurement and so more likely to come up with better conclusions.
Made by Evita Schippers
• Nonmetric scales • Metric scales
o Nominal o Internal
Lecture 1. Introductory Lecture o Ordinal o Ratio
Statistical tests exist to support strategic and tactical marketing decisions like for example Nominal scale
segmentation, targeting, positioning and to guide the 4 marketing mix decisions (product, • Characteristics: unique definition/identification classification
price, distribution, and communication). This are some examples of marketing research • Phenomena: e.g. brand name, gender, student ANR
problems: • Appropriate methods of analysis/statistics: e.g. %, mode, chi square tests
• Mars Pet Food (segmentation and targeting): What types of ‘pet food shoppers’
can we distinguish, and how can we optimally market our products to them? Example shampoo brand identification:
• Campagnolo Sportswear, Villa Pardoes, Esprit (image/competitive positioning): • Palmolive 1
What is our brand image relative to competitors? • Fructis 2
• Dela, Brain Wash, T-Mobile (optimal “product package”): How can we optimize • Albert Heijn 3
our ‘product package?
• Albert Heijn (impact of local promotion ads): How effective are local promotion The numbers identify the brands. You can classify but you cannot conduct calculations like
ads at increasing store traffic and sales? an average ANR-number. It is especially useful to create insights in a target group, like for
• Intermaché, Leclerc (effectiveness click&collect formats and in-store displays): example a percentage of students who …, or the preferences for particular brands. You
Which type of click-and-collect is most likely to increase chain traffic and are able to create crosstabs with a chi square test like the influence of gender on a chosen
spending. brand. You can only do percentages, modes or look for links between multiple variables.
• Fietsenwinkel.nl: Which types of keywords are most likely used (and generate Ordinal scale
the highest ad impressions) on which types of devices? • Characteristics: indicate order, sequence
• Phenomena: e.g. preference ranking, level of education
1.1 Introduction • Appropriate methods of analysis/statistics: e.g. percentiles, median, rank
Defining Multivariate analysis correlation, and all previous statistics
‘Broadly speaking, it refers to all statistical methods that simultaneously analyze multiple
measurements on each individual or object under investigation.’ Example shampoo brand preference:
Why bother? • Albert Heijn • Fructis • Palmolive
• Almost every real life marketing problem requires statistical analysis of several 3 2 1
variables: you need them in your toolkit. For data or facts to support decisions. Example shopping frequency
• Crucial for master thesis Category
o Translate marketing problem Daily 1 >6
o Collect data and analyze data using SPSS 2 to 5 times a week 2 3,5
Some basic concepts Once a week 3 1
Every two weeks 4 0,5
• Measurement scales
Less than twice a month 5 <0,5
• Errors: reliability and validity
• Statistical significance and power
To measure some things, we need measurement scales. Depending on the scale you could An ordinal scale is often used to make an order like most favorable or least preference>
do various actions with the data and methods you choose. Metric scales are for You can calculate the median and percentiles like 10% above … and 90% under … There is
calculations and the nonmetric scales aren’t suitable for that. Scales are important no numeric value because you cannot calculate with ordinal scales. What you can do is to
look for an average number and calculate with that. The last row in the above table is
because you can sometimes not use or transform particular scales, decide before you use
translated to the shopping frequency per week.
a method.
Made by Evita Schippers
, Interval scale With reliability you want to know if there are measurement errors in the outcome, and
• Characteristics: arbitrary origin you will end up the next time with the same results. When that is not the case there could
• Phenomena: e.g. attribute score, price index be something wrong with the measurement. Validity means that you measure what you
• Appropriate methods of analysis/statistics: e.g. arithmetic average, range, are supposed to measure. Even if data is reliable, it may be not valid. Reliability is
standard deviation, product-moment correlation, and previous methods necessary for validity.
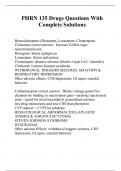
Statistical significance and power
Example shampoo brand quality score: Reality
• Palmolive 95 H0: No difference Ha: Difference
Statistical
decision
• Fructis 90 H0: No difference 1-α β (type II error)
• Albert Heijn 49 Ha: Difference α (type I error) 1-β (power)
Besides an order, there is an indication of difference in brand quality. You can calculate We measure a subset or sample of the population so there is more chance of errors, also
the nominal average, lowest –highest score, and the normal Pearson Correlation errors during measuring data. Type 1 error means that there is no difference in reality, but
coefficient. There is no (natural) zero point, it is a relative measure because it has an the test concludes there is a difference. Type 2 error means there is a difference but you
arbitrary origin that is fixed by the researcher. The difference in degree of preference is conclude there is not a difference. You would like to have 1-α or 1-β (power). You need a
different between the brands. But you cannot say Palmolive is twice more preferred, cutoff to make sure you don’t have a large type 1 error.
that’s because the point is arbitrary. Hypothesis testing (ctd)
Ratio Scale • Type 1 error (α) is that the probability of the test is showing statistical
• Characteristics: unique origin significance when it is not present (false positive).
• Phenomena: e.g. age, cost, number of customers • Power (1-β) is that the probability of the test is showing statistical significance
• Appropriate methods of analysis/statistics: e.g. geometric average, coefficient of when it is present.
variation, and all previous methods Suppose that the truth is “no difference”, what
would error-free population measure lead to? You
Example shampoo brand price: will seldom observe all (fe)male students, you work
• Palmolive €0.81 with a sample, and work with a measurement error.
• Fructis €1.82 Even if you will measure and observe, you cannot
• Albert Heijn €1.40 say there is (no) difference. In safety margin we
conclude that it’s only positive as the measurement
You can you in here extra methods, but they’re not widely used in practice. What you can is higher than a cutoff, this has to be determined. If you increase the cutoff (reduce
calculate for instance is the coefficient of variation and mean. Here you can say that probability that you decide difference whether there is not), you increase the chance on a
Fructis is twice more expensive as Palmolive. type 2 error.
Errors: Reliability and validity Power
• Reliability: Is the measure consistent, correctly registered? • Power depends on α (+), effect size (+), and sample size n (+)
• Validity: Does the measure capture the concept it is supposed to measure? • Implications
o Anticipate consequences of α, effect and n
For example, income. What is your income level? Has to be more specified like before or o Assess/incorporate power when interpreting results.
after taxes, together or alone, from work or extra activities, monthly or yearly? Not If you allow a to go up, there is a bigger chance for power (it’s the same as making the cut
specifying leads to problems with lack of reliability. Do you want to know if they are off lower or going to the left), only when you can live with a bigger chance of risk. Power
financially healthy or wealthy? Is it a perfect measure for someone’s wealthy? No, is the probability that you decided there is difference and in fact there is a difference.
because they could also be rich because of a heritage, that is validity. When effect goes up, it means the bigger the difference, the higher effect size and also
more power. A bigger sample size ensures a higher reliability and less plagued by errors in
the measurement and so more likely to come up with better conclusions.
Made by Evita Schippers