M9: Exam
Question 1
Suppose you have 45 data points and you calculate the sample correlation coefficient
and find that r = .32. Can you be 95% confident that a linear relation exists between the
variables? If so, is the relation positive or negative? Justify you answer.
Note that for n=45 and 95% we get a value from the chart of .29396. The absolute
of r is |r|=.32, which is above .29396. So a positive linear relation exists.
Question 2
Suppose you have 34 data points and you calculate the sample correlation coefficient
and find that r = - .35. Can you be 95% confident that a linear relation exists between
the variables? If so, is the relation positive or negative? Justify you answer.
Your Answer:
Note that for n=34 and 95% we get a value from the chart of .33879. The absolute
of r is |r|=.35, which is above .33879. So a negative linear relation exists.
Question 3
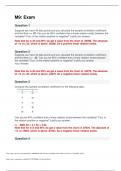
Compute the sample correlation coefficient for the following data:
Can you be 95% confident that a linear relation exists between the variables? If so, is
the relation positive or negative? Justify you answer.
r= - .9683 Sx = 2.7 Sy = 3.54.
Note that for n=5 and 95% we get a value from the chart of .87834. The absolute of
r is |r|=.9683, which is above .87834. So a negative linear relation exists.
Question 4
This study source was downloaded by 100000846744270 from CourseHero.com on 06-14-2023 01:11:38 GMT -05:00
https://www.coursehero.com/file/95714958/Math-110-Exam-9docx/
Question 1
Suppose you have 45 data points and you calculate the sample correlation coefficient
and find that r = .32. Can you be 95% confident that a linear relation exists between the
variables? If so, is the relation positive or negative? Justify you answer.
Note that for n=45 and 95% we get a value from the chart of .29396. The absolute
of r is |r|=.32, which is above .29396. So a positive linear relation exists.
Question 2
Suppose you have 34 data points and you calculate the sample correlation coefficient
and find that r = - .35. Can you be 95% confident that a linear relation exists between
the variables? If so, is the relation positive or negative? Justify you answer.
Your Answer:
Note that for n=34 and 95% we get a value from the chart of .33879. The absolute
of r is |r|=.35, which is above .33879. So a negative linear relation exists.
Question 3
Compute the sample correlation coefficient for the following data:
Can you be 95% confident that a linear relation exists between the variables? If so, is
the relation positive or negative? Justify you answer.
r= - .9683 Sx = 2.7 Sy = 3.54.
Note that for n=5 and 95% we get a value from the chart of .87834. The absolute of
r is |r|=.9683, which is above .87834. So a negative linear relation exists.
Question 4
This study source was downloaded by 100000846744270 from CourseHero.com on 06-14-2023 01:11:38 GMT -05:00
https://www.coursehero.com/file/95714958/Math-110-Exam-9docx/