Statistics II
Lecture 1: 1-way ANOVA
We can use ANOVA to see whether three or more groups have the same
population mean
Example question type:
'Do three or more groups have the same population mean and are the
populations classified according to one factor'
You could run multiple t-tests to answer this question, but the issue here is
inflation of surprise (= When one performs multiple comparisons on the same
data, the probability of finding a
surprising result goes up)
Risk of Type 1 error increases
ANOVA = ANalysis Of VAriance
Predictor variables are categorical factors
ANOVA is a family of statistical tests:
1. 1-way
Observations are independent (each participant measured only once)
1 experimental condition
2. Factorial
Observations are independent
2 or more experimental conditions. We can measure;
Individual effects
Interactions
3. Repeated measures
Observations are non independent
Statistics II 1
, Each subject is tested more than once or each stimulus is presented more
than once
Between group = different groups or subjects assigned to different conditions
Within group = the same subject is testes in more than 1 condition
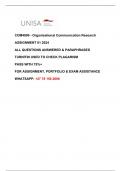
Example;
Statistics II 2
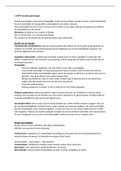
, Use function aov() to run anova test. Here; does number of modulations depend on
age?
On the slide above you see, result in R & Anova table you see in textbooks
Residuals = variation within each of the groups
DFG= number of groups - 1
DFE = number of observations - number of groups (nrow-nlevels)
SSG = how much variation there is between groups, measures variation of the group
means around the overall mean. Number of observations * (mean group-overall
mean) ^2
SSE = how much variation there is within groups
SST = Sum of squares total, SSG+ SSE
Mean sq = Sum sq / Df ; MSG = SSG/DFG
Statistics II 3
Lecture 1: 1-way ANOVA
We can use ANOVA to see whether three or more groups have the same
population mean
Example question type:
'Do three or more groups have the same population mean and are the
populations classified according to one factor'
You could run multiple t-tests to answer this question, but the issue here is
inflation of surprise (= When one performs multiple comparisons on the same
data, the probability of finding a
surprising result goes up)
Risk of Type 1 error increases
ANOVA = ANalysis Of VAriance
Predictor variables are categorical factors
ANOVA is a family of statistical tests:
1. 1-way
Observations are independent (each participant measured only once)
1 experimental condition
2. Factorial
Observations are independent
2 or more experimental conditions. We can measure;
Individual effects
Interactions
3. Repeated measures
Observations are non independent
Statistics II 1
, Each subject is tested more than once or each stimulus is presented more
than once
Between group = different groups or subjects assigned to different conditions
Within group = the same subject is testes in more than 1 condition
Example;
Statistics II 2
, Use function aov() to run anova test. Here; does number of modulations depend on
age?
On the slide above you see, result in R & Anova table you see in textbooks
Residuals = variation within each of the groups
DFG= number of groups - 1
DFE = number of observations - number of groups (nrow-nlevels)
SSG = how much variation there is between groups, measures variation of the group
means around the overall mean. Number of observations * (mean group-overall
mean) ^2
SSE = how much variation there is within groups
SST = Sum of squares total, SSG+ SSE
Mean sq = Sum sq / Df ; MSG = SSG/DFG
Statistics II 3