Tentamen (uitwerkingen)
TextAnalytics_Week3_NEC_solved
Beoordeling
Verkocht
-
Pagina's
5
Cijfer
A+
Geüpload op
18-04-2023
Geschreven in
2022/2023
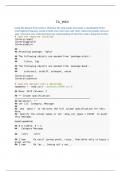
Using the dataset from week 2, eliminate the stop words and create a visualization of the highest frequency words in both a bar chart and a pie chart. Label your graphs and your axes. Comment your code showing your understanding of what the code is doing line by line.
Meer zien
Lees minder
Instelling
Text Analytics
Vak
Text Analytics
Oeps! We kunnen je document nu niet laden. Probeer het nog eens of neem contact op met support.
Gekoppeld boek
Geschreven voor
- Instelling
- Text Analytics
- Vak
- Text Analytics
Documentinformatie
- Geüpload op
- 18 april 2023
- Bestand laatst geupdate op
- 18 juli 2023
- Aantal pagina's
- 5
- Geschreven in
- 2022/2023
- Type
- Tentamen (uitwerkingen)
- Bevat
- Vragen en antwoorden
Onderwerpen
-
textanalyticsweek3necsolved
$10.99
Krijg toegang tot het volledige document:
Verkeerd document? Gratis ruilen
Binnen 14 dagen na aankoop en voor het downloaden kan je een ander document kiezen. Je kan het bedrag gewoon opnieuw besteden.
Geschreven door studenten die geslaagd zijn
Direct beschikbaar na je betaling
Online lezen of als PDF
Ook beschikbaar in voordeelbundel
Voordeelbundel
TextAnalytics_NEC_All_Weeks_Solved
1
13
2023
$ 142.87
Meer info