, A Roadmap for Selecting
a Statistical Method
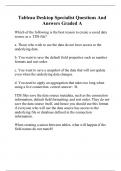
Data Analysis Task For Numerical Variables For Categorical Variables
Describing a group or Ordered array, stem-and-leaf display, frequency Summary table, bar chart, pie chart,
several groups distribution, relative frequency distribution, doughnut chart, Pareto chart
percentage distribution, cumulative percentage (Sections 2.1 and 2.3)
distribution, histogram, polygon, cumulative percentage
polygon (Sections 2.2, 2.4)
Mean, median, mode, geometric mean, quartiles, range,
interquartile range, standard deviation,
variance, coefficient of variation, skewness,
kurtosis, boxplot, normal probability plot
(Sections 3.1, 3.2, 3.3, 6.3)
Index numbers (online Section 16.8)
Dashboards (Section 17.2)
Inference about one Confidence interval estimate of the mean Confidence interval estimate of the
group (Sections 8.1 and 8.2) proportion (Section 8.3)
t test for the mean (Section 9.2) Z test for the proportion
Chi-square test for a variance or standard deviation (Section 9.4)
(online Section 12.7)
Comparing two groups Tests for the difference in the means of two Z test for the difference between two
independent populations (Section 10.1) proportions (Section 10.3)
Wilcoxon rank sum test (Section 12.4) Chi-square test for the difference between
Paired t test (Section 10.2) two proportions (Section 12.1)
F test for the difference between two variances McNemar test for two related
(Section 10.4) samples (online Section 12.6)
Wilcoxon signed ranks test (online Section 12.8)
Comparing more than One-way analysis of variance for comparing Chi-square test for differences
two groups several means (Section 11.1) among more than two proportions
Kruskal-Wallis test (Section 12.5) (Section 12.2)
Randomized block design (online Section 11.3)
Two-way analysis of variance (Section 11.2)
Friedman rank test (online Section 12.9)
Analyzing the Scatter plot, time series plot (Section 2.5) Contingency table, side-by-side bar
relationship between Covariance, coefficient of correlation (Section 3.5) chart, PivotTables
two variables (Sections 2.1, 2.3, 2.6)
Simple linear regression (Chapter 13)
Chi-square test of independence
t test of correlation (Section 13.7)
(Section 12.3)
Time-series forecasting (Chapter 16)
Sparklines (Section 2.7)
Analyzing the Colored scatter plots, bubble chart, treemap Multidimensional contingency tables
relationship between (Section 2.7) (Section 2.6)
two or more variables Multiple regression (Chapters 14 and 15) Drilldown and slicers (Section 2.7)
Dynamic bubble charts (Section 17.2) Logistic regression (Section 14.7)
Regression trees (Section 17.3) Classification trees (Section 17.4)
Cluster analysis (Section 17.5) Multiple correspondence analysis
Multidimensional scaling (Section 17.6) (Section 17.6)
A01_BERE4840_14_SE_FM.indd 1 12/7/17 8:48
a Statistical Method
Data Analysis Task For Numerical Variables For Categorical Variables
Describing a group or Ordered array, stem-and-leaf display, frequency Summary table, bar chart, pie chart,
several groups distribution, relative frequency distribution, doughnut chart, Pareto chart
percentage distribution, cumulative percentage (Sections 2.1 and 2.3)
distribution, histogram, polygon, cumulative percentage
polygon (Sections 2.2, 2.4)
Mean, median, mode, geometric mean, quartiles, range,
interquartile range, standard deviation,
variance, coefficient of variation, skewness,
kurtosis, boxplot, normal probability plot
(Sections 3.1, 3.2, 3.3, 6.3)
Index numbers (online Section 16.8)
Dashboards (Section 17.2)
Inference about one Confidence interval estimate of the mean Confidence interval estimate of the
group (Sections 8.1 and 8.2) proportion (Section 8.3)
t test for the mean (Section 9.2) Z test for the proportion
Chi-square test for a variance or standard deviation (Section 9.4)
(online Section 12.7)
Comparing two groups Tests for the difference in the means of two Z test for the difference between two
independent populations (Section 10.1) proportions (Section 10.3)
Wilcoxon rank sum test (Section 12.4) Chi-square test for the difference between
Paired t test (Section 10.2) two proportions (Section 12.1)
F test for the difference between two variances McNemar test for two related
(Section 10.4) samples (online Section 12.6)
Wilcoxon signed ranks test (online Section 12.8)
Comparing more than One-way analysis of variance for comparing Chi-square test for differences
two groups several means (Section 11.1) among more than two proportions
Kruskal-Wallis test (Section 12.5) (Section 12.2)
Randomized block design (online Section 11.3)
Two-way analysis of variance (Section 11.2)
Friedman rank test (online Section 12.9)
Analyzing the Scatter plot, time series plot (Section 2.5) Contingency table, side-by-side bar
relationship between Covariance, coefficient of correlation (Section 3.5) chart, PivotTables
two variables (Sections 2.1, 2.3, 2.6)
Simple linear regression (Chapter 13)
Chi-square test of independence
t test of correlation (Section 13.7)
(Section 12.3)
Time-series forecasting (Chapter 16)
Sparklines (Section 2.7)
Analyzing the Colored scatter plots, bubble chart, treemap Multidimensional contingency tables
relationship between (Section 2.7) (Section 2.6)
two or more variables Multiple regression (Chapters 14 and 15) Drilldown and slicers (Section 2.7)
Dynamic bubble charts (Section 17.2) Logistic regression (Section 14.7)
Regression trees (Section 17.3) Classification trees (Section 17.4)
Cluster analysis (Section 17.5) Multiple correspondence analysis
Multidimensional scaling (Section 17.6) (Section 17.6)
A01_BERE4840_14_SE_FM.indd 1 12/7/17 8:48