6/9/2017 Respiratory FRCEM Success
Dashboard Subscription expires in: 1 Days Extend
You have scored 24%
You answered 21 correct out of 87 questions.
Your answers are shown below:
Regarding V/Q mismatch, which of the following statements is INCORRECT:
a)
Regions of high V/Q cannot compensate for regions of low V/Q and the net effect of mixing blood from areas with
V/Q mismatch is a low PaO2.
b)
Regional ventilation and perfusion can be visualised by inhalation and infusion of appropriate radioisotopes on a
V/Q scan.
c) The gravitational effects causing regional V/Q mismatch increase with age.
d) In V/Q mismatch, increasing oxygen fraction does not improve arterial oxygen content.
e) Regions of the lung with V/Q > 1 will have raised PaO2 and low PaCO2.
Something wrong?
Answer
In V/Q mismatch, increasing oxygen fraction can signi cantly improve arterial oxygen content, however in a true shunt
increasing oxygen fraction has no effect because the oxygen-enriched air fails to reach the shunted blood.
Notes
At rest, total alveolar ventilation and total pulmonary blood ow are similar, each being around 5 L/min. To achieve
ef cient gas exchange, it is essential that the ow of gas (ventilation, V) and the ow of blood (perfusion, Q) are closely
matched throughout all regions of the lung. Ideally, local ventilation-perfusion (V/Q) ratios should be as close to 1 as
possible.
V/Q mismatch
http://frcemsuccess.com/rev/sc29/ 1/151
,6/9/2017 Respiratory FRCEM Success
V/Q mismatch
When there are signi cant regional variations in ventilation or perfusion, this is referred to as ventilation-perfusion
(V/Q) mismatch.
There are two extremes of V/Q mismatch:
1. Dead space
Lung region with normal alveolar ventilation but absent perfusion
Caused by large pulmonary embolus for example
Q = 0, therefore V/Q = ∞
The Po2 and Pco2 of alveolar gas will approach their values in inspired air
2. True shunt
Lung region with normal perfusion but absent alveolar ventilation
Caused by complete collapse or consolidation of a lung region for example
V = 0, therefore V/Q = 0
The Po2 and Pco2 of pulmonary capillary blood (and, therefore, of systemic arterial blood) will approach
their values in mixed venous blood
Effect of V/Q mismatch on arterial gases
Regions of the lung with V/Q > 1 have excessive ventilation relative to perfusion with a dead space effect, and blood
derived from them will have raised PaO2 and low PaCO2. This may be seen in emphysematous areas where capillaries
are destroyed or where pulmonary emboli are partially blocking blood ow.
Regions of the lung with V/Q < 1 have reduced ventilation relative to perfusion with a shunt effect, and blood
derived from them will have low PaO2 and raised PaCO2. This may be seen when airways are partly blocked by
bronchoconstriction, in ammation or secretions.
Regions of high V/Q cannot compensate for regions of low V/Q and the net effect of mixing blood from areas with V/Q
mismatch is a low PaO2 and a normal/low PaCO2. Hypoxic vasoconstriction helps to reduce the severity of V/Q
mismatching by diverting blood from regions with low V/Q ratios to regions that are better ventilated.
In V/Q mismatch, increasing oxygen fraction can signi cantly improve arterial oxygen content, however in a true shunt
increasing oxygen fraction has no effect because the oxygen-enriched air fails to reach the shunted blood.
Gravitational effects on V/Q mismatch
Both ventilation and perfusion increase towards the lung base, because of the effects of gravity, but the gravitational
effects are greater on perfusion than ventilation and therefore there is a regional variation in V/Q ratio from lung apex
(high V/Q) to lung base (low V/Q). In young people, this gravitational effect is modest and has little effect on blood
gases, but the V/Q mismatch increases with age and contributes to the reduction in PaO2 seen in the elderly.
Regional ventilation and perfusion can be visualised by inhalation and infusion of appropriate radioisotopes on a V/Q
scan.
A-a gradient
http://frcemsuccess.com/rev/sc29/ 2/151
,6/9/2017 Respiratory FRCEM Success
A-a gradient
The cause of a hypoxia can be classi ed by the alveolar-arterial PO2 gradient (A-a gradient). The alveolar gradient is
calculated as PAO2 – PaO2.
A normal A-a gradient is seen in alveolar hypoventilation or low inspired PO2 (e.g. at high altitude). An increased A-a
gradient re ects a diffusion defect (rare), V/Q mismatch or a right-to-left shunt.
In healthy young people, there is a small A-a gradient (< 2 kPa) arising from the normal anatomical right-to-left shunts.
The normal value for the A-a gradient increases with age.
Regarding 2,3-DPG, which of the following statements is INCORRECT:
a) It is raised in chronic anaemia.
b) It is raised at high altitude.
c) It is produced by red blood cells.
d) It shifts the oxygen-haemoglobin dissociation curve to the left.
e) It binds less avidly to foetal haemoglobin.
Something wrong?
Answer
The metabolic by-product 2,3-diphosphoglycerate (2,3 -DPG), produced in red blood cells by glycolysis, causes a right
shift of the oxygen dissociation curve. 2, 3 -DPG may be raised in strenuous exercise, chronic anaemia, chronic lung
disease, or at high altitude. Foetal haemoglobin (HbF) binds 2, 3 -DPG less strongly than does adult haemoglobin
(HbA), and so the HbF dissociation curve lies to the left of that for HbA, re ecting its higher oxygen af nity.
Notes
The solubility of oxygen in blood plasma is low and only a very small percentage of the body’s requirement can be
carried in the dissolved form (< 10 mL), therefore most oxygen is carried bound to haemoglobin in red blood cells.
Haemoglobin
Each gram of haemoglobin binds with up to 1.34 mL oxygen, so with a haemoglobin concentration of 150 g/L, blood
contains a maximum of 200 mL/L oxygen bound to haemoglobin; this is the oxygen capacity, which varies with [Hb].
The actual amount of oxygen bound to haemoglobin depends on the PO2. Low PO2 in tissue capillaries promotes
oxygen release from haemoglobin, whereas the high PO2 in pulmonary capillaries promotes oxygen binding.
Each molecule of haemoglobin can bind up to four molecules of oxygen, at which point it is said to be
saturated. Haemoglobin binds oxygen in a cooperative fashion; this means as each oxygen molecule binds, there is a
conformational change in its protein structure and its af nity for oxygen increases, making it easier to bind the next
oxygen molecule.
http://frcemsuccess.com/rev/sc29/ 3/151
, 6/9/2017 Respiratory FRCEM Success
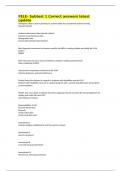
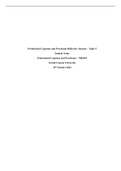
Oxygen-haemoglobin dissociation curve
The oxygen dissociation curve is a graph that plots the proportion of haemoglobin in its oxygen-laden saturated form
on the vertical axis against the partial pressure of oxygen on the horizontal axis.
Cooperative binding is responsible for the steepness of the oxygen-haemoglobin dissociation curve in the middle. The
curve attens again at partial pressures above about 8 kPa because there are few un lled haemoglobin binding sites.
Thus for a normal arterial PO2 (about 13 kPa) and [Hb], the blood is about 97% saturated and any increase in PO2 will
have little effect on the blood oxygen content. On the steep part of the curve however (< 8 kPa), small changes in PO2
will have large effects on the blood oxygen content. The PO2 at which the haemoglobin is 50% saturated is known as
the P50 (the P50 is higher for a right-shifted curve and lower for a left-shifted curve).
Modi ed by FRCEM Success. Original image by Peter Southwood (Own work) [CC0], via Wikimedia
Commons
Factors affecting oxygen-haemoglobin curve
The af nity of haemoglobin for oxygen, and hence the position of the dissociation curve, varies with local conditions.
A decreased af nity of haemoglobin for oxygen (and hence increased ease of dissociation), shown by a right shift in the
oxygen dissociation curve, is caused by a fall in pH, a rise in PCO2 (the Bohr effect) and an increase in temperature.
These changes occur in metabolically active tissues such as in exercise, and encourage oxygen release. The metabolic
by-product 2,3-diphosphoglycerate (2,3 -DPG) also causes a right shift; 2, 3 -DPG may also be raised in chronic
http://frcemsuccess.com/rev/sc29/ 4/151
Dashboard Subscription expires in: 1 Days Extend
You have scored 24%
You answered 21 correct out of 87 questions.
Your answers are shown below:
Regarding V/Q mismatch, which of the following statements is INCORRECT:
a)
Regions of high V/Q cannot compensate for regions of low V/Q and the net effect of mixing blood from areas with
V/Q mismatch is a low PaO2.
b)
Regional ventilation and perfusion can be visualised by inhalation and infusion of appropriate radioisotopes on a
V/Q scan.
c) The gravitational effects causing regional V/Q mismatch increase with age.
d) In V/Q mismatch, increasing oxygen fraction does not improve arterial oxygen content.
e) Regions of the lung with V/Q > 1 will have raised PaO2 and low PaCO2.
Something wrong?
Answer
In V/Q mismatch, increasing oxygen fraction can signi cantly improve arterial oxygen content, however in a true shunt
increasing oxygen fraction has no effect because the oxygen-enriched air fails to reach the shunted blood.
Notes
At rest, total alveolar ventilation and total pulmonary blood ow are similar, each being around 5 L/min. To achieve
ef cient gas exchange, it is essential that the ow of gas (ventilation, V) and the ow of blood (perfusion, Q) are closely
matched throughout all regions of the lung. Ideally, local ventilation-perfusion (V/Q) ratios should be as close to 1 as
possible.
V/Q mismatch
http://frcemsuccess.com/rev/sc29/ 1/151
,6/9/2017 Respiratory FRCEM Success
V/Q mismatch
When there are signi cant regional variations in ventilation or perfusion, this is referred to as ventilation-perfusion
(V/Q) mismatch.
There are two extremes of V/Q mismatch:
1. Dead space
Lung region with normal alveolar ventilation but absent perfusion
Caused by large pulmonary embolus for example
Q = 0, therefore V/Q = ∞
The Po2 and Pco2 of alveolar gas will approach their values in inspired air
2. True shunt
Lung region with normal perfusion but absent alveolar ventilation
Caused by complete collapse or consolidation of a lung region for example
V = 0, therefore V/Q = 0
The Po2 and Pco2 of pulmonary capillary blood (and, therefore, of systemic arterial blood) will approach
their values in mixed venous blood
Effect of V/Q mismatch on arterial gases
Regions of the lung with V/Q > 1 have excessive ventilation relative to perfusion with a dead space effect, and blood
derived from them will have raised PaO2 and low PaCO2. This may be seen in emphysematous areas where capillaries
are destroyed or where pulmonary emboli are partially blocking blood ow.
Regions of the lung with V/Q < 1 have reduced ventilation relative to perfusion with a shunt effect, and blood
derived from them will have low PaO2 and raised PaCO2. This may be seen when airways are partly blocked by
bronchoconstriction, in ammation or secretions.
Regions of high V/Q cannot compensate for regions of low V/Q and the net effect of mixing blood from areas with V/Q
mismatch is a low PaO2 and a normal/low PaCO2. Hypoxic vasoconstriction helps to reduce the severity of V/Q
mismatching by diverting blood from regions with low V/Q ratios to regions that are better ventilated.
In V/Q mismatch, increasing oxygen fraction can signi cantly improve arterial oxygen content, however in a true shunt
increasing oxygen fraction has no effect because the oxygen-enriched air fails to reach the shunted blood.
Gravitational effects on V/Q mismatch
Both ventilation and perfusion increase towards the lung base, because of the effects of gravity, but the gravitational
effects are greater on perfusion than ventilation and therefore there is a regional variation in V/Q ratio from lung apex
(high V/Q) to lung base (low V/Q). In young people, this gravitational effect is modest and has little effect on blood
gases, but the V/Q mismatch increases with age and contributes to the reduction in PaO2 seen in the elderly.
Regional ventilation and perfusion can be visualised by inhalation and infusion of appropriate radioisotopes on a V/Q
scan.
A-a gradient
http://frcemsuccess.com/rev/sc29/ 2/151
,6/9/2017 Respiratory FRCEM Success
A-a gradient
The cause of a hypoxia can be classi ed by the alveolar-arterial PO2 gradient (A-a gradient). The alveolar gradient is
calculated as PAO2 – PaO2.
A normal A-a gradient is seen in alveolar hypoventilation or low inspired PO2 (e.g. at high altitude). An increased A-a
gradient re ects a diffusion defect (rare), V/Q mismatch or a right-to-left shunt.
In healthy young people, there is a small A-a gradient (< 2 kPa) arising from the normal anatomical right-to-left shunts.
The normal value for the A-a gradient increases with age.
Regarding 2,3-DPG, which of the following statements is INCORRECT:
a) It is raised in chronic anaemia.
b) It is raised at high altitude.
c) It is produced by red blood cells.
d) It shifts the oxygen-haemoglobin dissociation curve to the left.
e) It binds less avidly to foetal haemoglobin.
Something wrong?
Answer
The metabolic by-product 2,3-diphosphoglycerate (2,3 -DPG), produced in red blood cells by glycolysis, causes a right
shift of the oxygen dissociation curve. 2, 3 -DPG may be raised in strenuous exercise, chronic anaemia, chronic lung
disease, or at high altitude. Foetal haemoglobin (HbF) binds 2, 3 -DPG less strongly than does adult haemoglobin
(HbA), and so the HbF dissociation curve lies to the left of that for HbA, re ecting its higher oxygen af nity.
Notes
The solubility of oxygen in blood plasma is low and only a very small percentage of the body’s requirement can be
carried in the dissolved form (< 10 mL), therefore most oxygen is carried bound to haemoglobin in red blood cells.
Haemoglobin
Each gram of haemoglobin binds with up to 1.34 mL oxygen, so with a haemoglobin concentration of 150 g/L, blood
contains a maximum of 200 mL/L oxygen bound to haemoglobin; this is the oxygen capacity, which varies with [Hb].
The actual amount of oxygen bound to haemoglobin depends on the PO2. Low PO2 in tissue capillaries promotes
oxygen release from haemoglobin, whereas the high PO2 in pulmonary capillaries promotes oxygen binding.
Each molecule of haemoglobin can bind up to four molecules of oxygen, at which point it is said to be
saturated. Haemoglobin binds oxygen in a cooperative fashion; this means as each oxygen molecule binds, there is a
conformational change in its protein structure and its af nity for oxygen increases, making it easier to bind the next
oxygen molecule.
http://frcemsuccess.com/rev/sc29/ 3/151
, 6/9/2017 Respiratory FRCEM Success
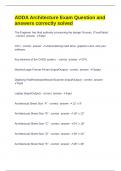
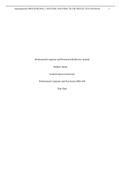
Oxygen-haemoglobin dissociation curve
The oxygen dissociation curve is a graph that plots the proportion of haemoglobin in its oxygen-laden saturated form
on the vertical axis against the partial pressure of oxygen on the horizontal axis.
Cooperative binding is responsible for the steepness of the oxygen-haemoglobin dissociation curve in the middle. The
curve attens again at partial pressures above about 8 kPa because there are few un lled haemoglobin binding sites.
Thus for a normal arterial PO2 (about 13 kPa) and [Hb], the blood is about 97% saturated and any increase in PO2 will
have little effect on the blood oxygen content. On the steep part of the curve however (< 8 kPa), small changes in PO2
will have large effects on the blood oxygen content. The PO2 at which the haemoglobin is 50% saturated is known as
the P50 (the P50 is higher for a right-shifted curve and lower for a left-shifted curve).
Modi ed by FRCEM Success. Original image by Peter Southwood (Own work) [CC0], via Wikimedia
Commons
Factors affecting oxygen-haemoglobin curve
The af nity of haemoglobin for oxygen, and hence the position of the dissociation curve, varies with local conditions.
A decreased af nity of haemoglobin for oxygen (and hence increased ease of dissociation), shown by a right shift in the
oxygen dissociation curve, is caused by a fall in pH, a rise in PCO2 (the Bohr effect) and an increase in temperature.
These changes occur in metabolically active tissues such as in exercise, and encourage oxygen release. The metabolic
by-product 2,3-diphosphoglycerate (2,3 -DPG) also causes a right shift; 2, 3 -DPG may also be raised in chronic
http://frcemsuccess.com/rev/sc29/ 4/151