7.2. How sample means vary around the
population mean
Recall
- Population distribution: the distribution of the random variable for the population from
which we sample
- Data distribution: the distribution of the sample data from one sample and the distribution
we see in practice
- Sampling distribution: the distribution of the sample statistic (sample proportion or sample
mean) from repeated random samples
Because the sample mean is so commonly used as a statistic to summarize sample numerical
(quantitative) data, we’ll now pay special attention to the sampling distribution of the sample mean.
We’ll discover results allowing us to predict how close a particular sample mean x falls to the
population mean μ.
As with the sampling distribution of the sample proportion, there are two main results about the
sampling distribution of the sample mean:
- Our result provides formulas for the mean and standard deviation of the sampling
distribution
- The other indicates that its shape is often approximately a normal distribution
Simulating the sampling distribution of the sample mean
- For a random sample size of n from a normally distributed population having mean μ and
standard deviation σ , then regardless of the sample size n, the sampling distribution of the
sample mean x is also normally distributed with its center described by the population
mean μ and the variability described by the standard deviation of the sampling distribution,
which equals the population standard deviation divided by the square root of the sample
σ
size,
√n
- In reality, the population distribution of a variable is rarely normal. What does this mean for
the sampling distribution? Will it still have a bell shape?
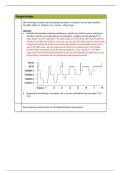
Simulating the sampling distribution for a sample mean from a non-bell-shaped distribution
- The theoretical sampling distribution of the sample mean has
o Mean equal to the population mean
o Standard deviation equal to the population standard deviation divided by √ n
o Has a bell shape
, Describing the behavior of the sampling distribution for the sample mean for any population
- Even when a population distribution is not bell shaped but skewed, the sampling distribution
of the sample mean appears to be the same as the population mean μ, and the standard
σ
deviation of the sampling distribution for the sample mean appears to be
√n
- The bell shape is a consequence of the central limit theorem (CLT)
o The sampling distribution of the sample mean x often has approximately a normal
distribution. This result applies no matter what shape of the population distribution
from which the samples are taken. For relatively large sample sizes, the sampling
distribution is bell shaped, even if the population distribution is highly discrete or
highly skewed.
Mean and standard deviation of the sampling distribution of the sample mean x
- From a random sample of size n from a population having mean μ and standard deviation σ ,
the sampling distribution of the sample mean x has mean equal to the population mean μ
and standard deviation equal to the standard deviation of the population divided by the
σ
square root of the sample size .
√n
The central limit theorem (CLT): describes the expected shape of the sampling distribution for a
sample mean x
population mean
Recall
- Population distribution: the distribution of the random variable for the population from
which we sample
- Data distribution: the distribution of the sample data from one sample and the distribution
we see in practice
- Sampling distribution: the distribution of the sample statistic (sample proportion or sample
mean) from repeated random samples
Because the sample mean is so commonly used as a statistic to summarize sample numerical
(quantitative) data, we’ll now pay special attention to the sampling distribution of the sample mean.
We’ll discover results allowing us to predict how close a particular sample mean x falls to the
population mean μ.
As with the sampling distribution of the sample proportion, there are two main results about the
sampling distribution of the sample mean:
- Our result provides formulas for the mean and standard deviation of the sampling
distribution
- The other indicates that its shape is often approximately a normal distribution
Simulating the sampling distribution of the sample mean
- For a random sample size of n from a normally distributed population having mean μ and
standard deviation σ , then regardless of the sample size n, the sampling distribution of the
sample mean x is also normally distributed with its center described by the population
mean μ and the variability described by the standard deviation of the sampling distribution,
which equals the population standard deviation divided by the square root of the sample
σ
size,
√n
- In reality, the population distribution of a variable is rarely normal. What does this mean for
the sampling distribution? Will it still have a bell shape?
Simulating the sampling distribution for a sample mean from a non-bell-shaped distribution
- The theoretical sampling distribution of the sample mean has
o Mean equal to the population mean
o Standard deviation equal to the population standard deviation divided by √ n
o Has a bell shape
, Describing the behavior of the sampling distribution for the sample mean for any population
- Even when a population distribution is not bell shaped but skewed, the sampling distribution
of the sample mean appears to be the same as the population mean μ, and the standard
σ
deviation of the sampling distribution for the sample mean appears to be
√n
- The bell shape is a consequence of the central limit theorem (CLT)
o The sampling distribution of the sample mean x often has approximately a normal
distribution. This result applies no matter what shape of the population distribution
from which the samples are taken. For relatively large sample sizes, the sampling
distribution is bell shaped, even if the population distribution is highly discrete or
highly skewed.
Mean and standard deviation of the sampling distribution of the sample mean x
- From a random sample of size n from a population having mean μ and standard deviation σ ,
the sampling distribution of the sample mean x has mean equal to the population mean μ
and standard deviation equal to the standard deviation of the population divided by the
σ
square root of the sample size .
√n
The central limit theorem (CLT): describes the expected shape of the sampling distribution for a
sample mean x