MACROECONOMICS CHAPTER 3
National Income: Where It Comes From and Where It Goes
GDP Gross domestic product measures:
● A nation’s total output of goods and services
● Its total income
● Nations with a high level of GDP per person have
everything from better childhood nutrition to more
computers per household.
An economy’s GDP depends on:
● Its quantity of inputs (the factors of production)
● Its ability to turn inputs into output (represented by
the production function)
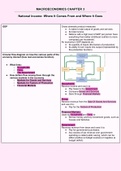
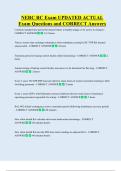
Circular flow diagram on how the various parts of the
economy interact (how real economies function)
● What links:
○ Households
○ Firms
○ The Government
● How dollars flow among them through the
various markets in the economy
○ Markets for Goods and Services
○ Markets for Factors of Production Households:
○ Financial Markets Receive income and use it to:
● Pay taxes to the Government
● Consume Goods and Services
● Save through Financial Markets
Firms:
Receive revenue from the Sale Of Goods And Services
and use it to:
● Pay for the Factors of Production
Financial Markets:
Used by Households and Firms to:
● Borrow money and buy investment goods, such as
houses and factories.
Government:
Receives revenue from taxes and uses it to:
● Pay for government purchases.
● Any excess of tax revenue over government
spending is called public saving, which can be
either positive (a budget surplus) or negative (a
budget deficit).
, MACROECONOMICS CHAPTER 3
National Income: Where It Comes From and Where It Goes
The Factors of Production The inputs (resources) used to produce goods and
services.
The two most important factors of production:
● Capital ( K )
○ The set of tools that workers use
○ Example: The accountant’s calculator, the
author’s computer
● Labor (L)
○ The time people spend working
The Production Function Shows the relationship between:
● Technological Change ● How much output (goods) is produced
● Constant returns to scale ● Given amounts of capital and labor.
The function:
Output Y =F (K , L)
Technological change:
● Alters the production function:
● Available production technology determines how
much output can be produced from K and L
● If someone invents a better way to produce
a good→ more Y from the same amounts of K
and L
Constant Returns to Scale:
● A property many production functions have
● When an increase of an equal % in all factors of
production causes an increase in output of the
same %
○ Example: increasing both K and L by 10%
results in 10% more output.
● Mathematically:
○ A production function has constant returns
to scale if zY =F(zK , zL) for any positive
number z
● The assumption of constant returns to scale
→ important implication for how the income
from production is distributed.
The Supply of Goods and Services The Supply Of Goods And Services→ The
Economy’s Output → National Income
● All are determined by The Factors Of Production
and The Production Function
To express this mathematically, we write
Y =F ( K , L)
¿Y
, MACROECONOMICS CHAPTER 3
National Income: Where It Comes From and Where It Goes
Factor Prices The amount paid to each unit of factors of production
● What they are for K and L
● The distribution of national income When the factors of production are Capital and Labor:
● How prices are determined ● The rent the owners of capital collect
● Graph ● The wage workers earn
The distribution of national income:
● Determined by factor prices.
The price for each factor of production:
● Determined by the supply and demand for that
factor.
● The quantity of the factor supplied to the market is
the same regardless of the factor price.
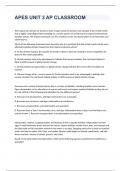
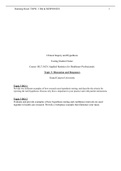
Factor Price And Quantity Graph
● If we assume that the economy’s factors of
production are fixed→ the factor supply
curve is vertical.
● The intersection of the downward-sloping factor
demand curve and the vertical supply curve
determines the equilibrium factor price.
National Income: Where It Comes From and Where It Goes
GDP Gross domestic product measures:
● A nation’s total output of goods and services
● Its total income
● Nations with a high level of GDP per person have
everything from better childhood nutrition to more
computers per household.
An economy’s GDP depends on:
● Its quantity of inputs (the factors of production)
● Its ability to turn inputs into output (represented by
the production function)
Circular flow diagram on how the various parts of the
economy interact (how real economies function)
● What links:
○ Households
○ Firms
○ The Government
● How dollars flow among them through the
various markets in the economy
○ Markets for Goods and Services
○ Markets for Factors of Production Households:
○ Financial Markets Receive income and use it to:
● Pay taxes to the Government
● Consume Goods and Services
● Save through Financial Markets
Firms:
Receive revenue from the Sale Of Goods And Services
and use it to:
● Pay for the Factors of Production
Financial Markets:
Used by Households and Firms to:
● Borrow money and buy investment goods, such as
houses and factories.
Government:
Receives revenue from taxes and uses it to:
● Pay for government purchases.
● Any excess of tax revenue over government
spending is called public saving, which can be
either positive (a budget surplus) or negative (a
budget deficit).
, MACROECONOMICS CHAPTER 3
National Income: Where It Comes From and Where It Goes
The Factors of Production The inputs (resources) used to produce goods and
services.
The two most important factors of production:
● Capital ( K )
○ The set of tools that workers use
○ Example: The accountant’s calculator, the
author’s computer
● Labor (L)
○ The time people spend working
The Production Function Shows the relationship between:
● Technological Change ● How much output (goods) is produced
● Constant returns to scale ● Given amounts of capital and labor.
The function:
Output Y =F (K , L)
Technological change:
● Alters the production function:
● Available production technology determines how
much output can be produced from K and L
● If someone invents a better way to produce
a good→ more Y from the same amounts of K
and L
Constant Returns to Scale:
● A property many production functions have
● When an increase of an equal % in all factors of
production causes an increase in output of the
same %
○ Example: increasing both K and L by 10%
results in 10% more output.
● Mathematically:
○ A production function has constant returns
to scale if zY =F(zK , zL) for any positive
number z
● The assumption of constant returns to scale
→ important implication for how the income
from production is distributed.
The Supply of Goods and Services The Supply Of Goods And Services→ The
Economy’s Output → National Income
● All are determined by The Factors Of Production
and The Production Function
To express this mathematically, we write
Y =F ( K , L)
¿Y
, MACROECONOMICS CHAPTER 3
National Income: Where It Comes From and Where It Goes
Factor Prices The amount paid to each unit of factors of production
● What they are for K and L
● The distribution of national income When the factors of production are Capital and Labor:
● How prices are determined ● The rent the owners of capital collect
● Graph ● The wage workers earn
The distribution of national income:
● Determined by factor prices.
The price for each factor of production:
● Determined by the supply and demand for that
factor.
● The quantity of the factor supplied to the market is
the same regardless of the factor price.
Factor Price And Quantity Graph
● If we assume that the economy’s factors of
production are fixed→ the factor supply
curve is vertical.
● The intersection of the downward-sloping factor
demand curve and the vertical supply curve
determines the equilibrium factor price.