Hoorcollege 1 – Kwantitatieve methoden
Correlation versus regression
Correlation and regression both rely on the same kind of calculations, but whatever correlation can
do, regression can do as well but also much more. When you’re making a regression, don’t refer to
the outcomes as a correlation!
Regression analysis
Technique to understand and quantitatively summarize relationships among variables.
Learn the basis of this technique.
Learn how to apply this technique.
Learn how to interpret this technique.
Relations between variables
Dependent variable Y = Variable to be explained.
Independent variable X = Explanatory variable.
Regress Y on X.
Causal effect is often hypothesized, but not necessarily.
o Positive and negative effects.
Examples in public administration
What is the relationship between:
Civil servant motivation and output?
Municipality spending and economic growth?
Law enforcement effort and crime rates?
Management strategies and school success?
Correlation coefficient (rho) or r
Degree of strength of (linear) association between two variables.
Is the standardized covariation between two variables X and Y.
The covariation between two variables is the way that we put those two things together.
When we have more of one, do we have more or less of the other?
Standardization with respect to scale (variation in X and variation in Y).
The correlation coefficient is also standardized, because we want some kind of metric that
tells us the same kind of information regardless of what me measure. This way the result will
always range between -1 and 1.
What is a variance?
The variance is the degree of difference in scores. It shows how far a score is relative to the average.
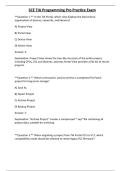
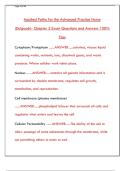
Product of deviances
Covariance (X, Y) = Sum of product of deviances in X and Y for all data points i.
, Variance (X) = Sum of squared deviances in X.
Variances (Y) = Sum of squared deviances in Y.
Interpretation
The correlation coefficient is a statistic/ numerical summary of the strength of a linear relationship
between X and Y.
Ranges from -1 to +1.
+1 means strong positive correlation or strong positive (linear) relationship.
-1 means strong negative correlation.
0 means no (linear) relationship.
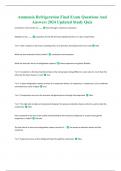
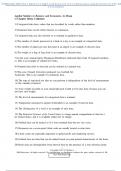
Additional interpretation
The slope of the regression line.
The correlation coefficient can’t distinguish the difference between the lines in the middle row, but
can distinguish the difference between the lines in the top row.
Even though there’s a pattern in the bottom row, the correlation coefficient can’t tell us anything
about the existence of those patterns, because correlations coefficients measure the strength of the
linear relationships between X and Y. The bottom row doesn’t contain linear relationships.
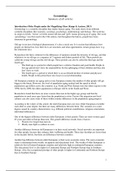
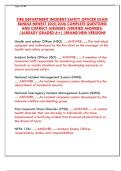
,Perfect positive correlation
No correlation
Scale of Y is smaller
, Y does not vary
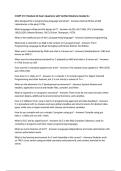
Not so perfect correlation
Outlier effect for small n
Correlation versus regression
Correlation and regression both rely on the same kind of calculations, but whatever correlation can
do, regression can do as well but also much more. When you’re making a regression, don’t refer to
the outcomes as a correlation!
Regression analysis
Technique to understand and quantitatively summarize relationships among variables.
Learn the basis of this technique.
Learn how to apply this technique.
Learn how to interpret this technique.
Relations between variables
Dependent variable Y = Variable to be explained.
Independent variable X = Explanatory variable.
Regress Y on X.
Causal effect is often hypothesized, but not necessarily.
o Positive and negative effects.
Examples in public administration
What is the relationship between:
Civil servant motivation and output?
Municipality spending and economic growth?
Law enforcement effort and crime rates?
Management strategies and school success?
Correlation coefficient (rho) or r
Degree of strength of (linear) association between two variables.
Is the standardized covariation between two variables X and Y.
The covariation between two variables is the way that we put those two things together.
When we have more of one, do we have more or less of the other?
Standardization with respect to scale (variation in X and variation in Y).
The correlation coefficient is also standardized, because we want some kind of metric that
tells us the same kind of information regardless of what me measure. This way the result will
always range between -1 and 1.
What is a variance?
The variance is the degree of difference in scores. It shows how far a score is relative to the average.
Product of deviances
Covariance (X, Y) = Sum of product of deviances in X and Y for all data points i.
, Variance (X) = Sum of squared deviances in X.
Variances (Y) = Sum of squared deviances in Y.
Interpretation
The correlation coefficient is a statistic/ numerical summary of the strength of a linear relationship
between X and Y.
Ranges from -1 to +1.
+1 means strong positive correlation or strong positive (linear) relationship.
-1 means strong negative correlation.
0 means no (linear) relationship.
Additional interpretation
The slope of the regression line.
The correlation coefficient can’t distinguish the difference between the lines in the middle row, but
can distinguish the difference between the lines in the top row.
Even though there’s a pattern in the bottom row, the correlation coefficient can’t tell us anything
about the existence of those patterns, because correlations coefficients measure the strength of the
linear relationships between X and Y. The bottom row doesn’t contain linear relationships.
,Perfect positive correlation
No correlation
Scale of Y is smaller
, Y does not vary
Not so perfect correlation
Outlier effect for small n