Quantitative Methods Revision Guide
Linear Equations
The equation of a straight line: The equation for demand: The equation for supply:
Y = ax + b Qd = b - aP where Qd is quantity Qs = b + aP where Qs is quanti-
demanded and P is price. ty supplied and P is price.
Y and x are your variables
The Law Of Demand states that The Law of Supply states that as
A is the slope of the line
as price rises, demand will fall, so price rises, supply will also rise,
B is the y intercept a < 0. Therefore P is a decreasing so a > 0. Therefore P is an in-
function of x. creasing function of x.
Sketching Demand and Supply Graphs:
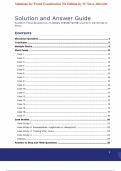
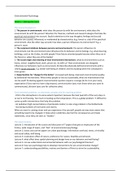
The relationship between quantity demanded and price is noted as: Qd = 40 - 2P. To be able to sketch this
equation, we have to find where the line crosses the x and y axis. We do this by setting Qd and P to zero
separately:
When Qd = 0: Now plot these points and join them up with a straight line, to
give the demand function:
0 = 40 - 2P
TIP: check your points
Rearrange to find the P intercept: to see if they give you
the correct slope:
2P = 40
28 - 8
Divide through to find the value of P:
6 - 16 = -2
P = 20
When P = 0:
Qd = 40- 0
Qd = 40
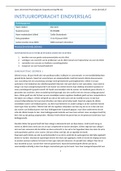
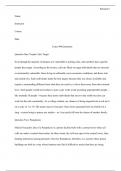
The relationship between quantity supplied and price is noted as: Qs = 10 + P. To be able to sketch this
equation, we have to find where the line crosses the x and y axis. We do this by setting Qs and P to zero
separately:
When Qs = 0: Now plot these points and join them up with a straight line, to
0 = 10 + P give the supply function:
Rearrange to find the P intercept: TIP: check your points
to see if they give you
-10 = P the correct slope:
When P = 0 5 - -5
QS = 10 - 0 -5 - -2 = 1
QS = 10
, Simultaneous Equations
We need to use simultaneous equations when we need to solve for two unknown variables, such as x
and y, from two equations. For example consider: x + 2y = 7 and x+ 4y = 11.
Using the Elimination Method, we can find the values of both x and y, following these steps:
Step: Working Out:
1– Multiply one or both of the equations so ( x + 2y = 7 ) x2 —> 2x + 4y = 14
that one of the variables has the same constant
as the corresponding constant in the second
equation
2—Subtract one of the equations from the oth- ( 2x + 4y = 14 ) - (x + 4y = 11) —> x = 3
er to eliminate the y variable and find the value
of x
3—Substitute the value of x into one of the
3 + 2y = 7
equations
2y = 7-3 = 4 y = 4/2 = 2 —> y = 2
4—Rearrange the equation to get y on its own
5—Substitute both values of x and y into one of
the equations to see if it’s correct 3 + (2x2) = 3+ 4 = 7.
This works so our values of x and y must be correct
Economic Application:
Using simultaneous equations allows us to find the values of quantity and price when the market is in
equilibrium. Since quantity supplied and quantity demanded will be the same when the market is in equi-
librium, we can solve for Q and P using supply and demand functions: P = 12 - 2Qd and P = 2 + 3Qs.
Graphically, the solutions we find using this method will be where the supply and demand functions
cross, thus demonstrating the equilibrium point.
Explanation: Working Out:
1– Since the constant for P is 1 for both equa- ( P = 12 - 2Qd ) - ( P = 2 +3Qs) —> 0P = 10 - 5Q
tions, we can subtract one function from the
other to eliminate P and leave Qd for us to
solve.
2—Rearrange the function to get Q on its own. 0P = 10 - 5Q —> 5Q = 10
3—Divide by 5 to find the value of Q (5Q = 10 ) / 5 —> Q = 2
4—Substitute Q = 2 into the first equation to
find the value of P. P = 12 - (2x2) = 12 - 4 = 8 —> P = 8
5—Substitute both values of Q and P into thee
second equation to see if it works for both
8 = 2 + (3x2) = 2+ 6 = 8
equations
This works so our values of Q and P must be correct
Linear Equations
The equation of a straight line: The equation for demand: The equation for supply:
Y = ax + b Qd = b - aP where Qd is quantity Qs = b + aP where Qs is quanti-
demanded and P is price. ty supplied and P is price.
Y and x are your variables
The Law Of Demand states that The Law of Supply states that as
A is the slope of the line
as price rises, demand will fall, so price rises, supply will also rise,
B is the y intercept a < 0. Therefore P is a decreasing so a > 0. Therefore P is an in-
function of x. creasing function of x.
Sketching Demand and Supply Graphs:
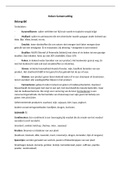
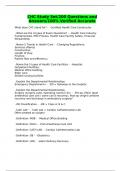
The relationship between quantity demanded and price is noted as: Qd = 40 - 2P. To be able to sketch this
equation, we have to find where the line crosses the x and y axis. We do this by setting Qd and P to zero
separately:
When Qd = 0: Now plot these points and join them up with a straight line, to
give the demand function:
0 = 40 - 2P
TIP: check your points
Rearrange to find the P intercept: to see if they give you
the correct slope:
2P = 40
28 - 8
Divide through to find the value of P:
6 - 16 = -2
P = 20
When P = 0:
Qd = 40- 0
Qd = 40
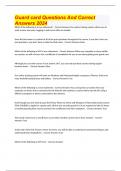
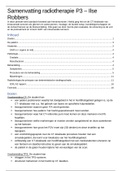
The relationship between quantity supplied and price is noted as: Qs = 10 + P. To be able to sketch this
equation, we have to find where the line crosses the x and y axis. We do this by setting Qs and P to zero
separately:
When Qs = 0: Now plot these points and join them up with a straight line, to
0 = 10 + P give the supply function:
Rearrange to find the P intercept: TIP: check your points
to see if they give you
-10 = P the correct slope:
When P = 0 5 - -5
QS = 10 - 0 -5 - -2 = 1
QS = 10
, Simultaneous Equations
We need to use simultaneous equations when we need to solve for two unknown variables, such as x
and y, from two equations. For example consider: x + 2y = 7 and x+ 4y = 11.
Using the Elimination Method, we can find the values of both x and y, following these steps:
Step: Working Out:
1– Multiply one or both of the equations so ( x + 2y = 7 ) x2 —> 2x + 4y = 14
that one of the variables has the same constant
as the corresponding constant in the second
equation
2—Subtract one of the equations from the oth- ( 2x + 4y = 14 ) - (x + 4y = 11) —> x = 3
er to eliminate the y variable and find the value
of x
3—Substitute the value of x into one of the
3 + 2y = 7
equations
2y = 7-3 = 4 y = 4/2 = 2 —> y = 2
4—Rearrange the equation to get y on its own
5—Substitute both values of x and y into one of
the equations to see if it’s correct 3 + (2x2) = 3+ 4 = 7.
This works so our values of x and y must be correct
Economic Application:
Using simultaneous equations allows us to find the values of quantity and price when the market is in
equilibrium. Since quantity supplied and quantity demanded will be the same when the market is in equi-
librium, we can solve for Q and P using supply and demand functions: P = 12 - 2Qd and P = 2 + 3Qs.
Graphically, the solutions we find using this method will be where the supply and demand functions
cross, thus demonstrating the equilibrium point.
Explanation: Working Out:
1– Since the constant for P is 1 for both equa- ( P = 12 - 2Qd ) - ( P = 2 +3Qs) —> 0P = 10 - 5Q
tions, we can subtract one function from the
other to eliminate P and leave Qd for us to
solve.
2—Rearrange the function to get Q on its own. 0P = 10 - 5Q —> 5Q = 10
3—Divide by 5 to find the value of Q (5Q = 10 ) / 5 —> Q = 2
4—Substitute Q = 2 into the first equation to
find the value of P. P = 12 - (2x2) = 12 - 4 = 8 —> P = 8
5—Substitute both values of Q and P into thee
second equation to see if it works for both
8 = 2 + (3x2) = 2+ 6 = 8
equations
This works so our values of Q and P must be correct