Unit 2 - Macroeconomics
Key terminology differences between Micro and Macroeconomics:
Micro (Unit 1) to Macro (Unit 2)
Price - Price level
Quantity - Real output
Demand - Aggregate demand
Supply - Aggregate supply
Small i.e. individual - Large i.e. economy as a whole
Macroeconomics can be studied at a national, international and global level. While
studying macroeconomics, we consider the economy as a whole, rather than individuals,
firms (single) or individual products.
Macroeconomic objective or the performance indicators:
The key macroeconomic objectives to remember are “BIIG BUSS”
● Balanced Budget (Government spending = Tax revenue)
● Inflation - (Price level to be low)
● Inequality - (To be low so that there is a narrow gap between the rich and poor)
● Growth - (Steady Economic growth)
● Balance of payment - (To be satisfactory BOP i.e. £ Inflow= £Outflow)
● Unemployment - (To be low)
● Standard of Living- (Improvement in quality of life and the material well-being)
● Sustainability & Stability- (No over-utilisation of scarce resources); Stability
(Avoid volatility/fluctuations in economic activities & achieving BIIG BUSS)
6
,Economic growth: (Key Objective)
In the short run, increase in (real) GDP and in the long run, improvement in the
productive capacity and potential.
GDP (Gross domestic product) - The total value of the final goods and services
produced in an economy in one financial year.
Value (£Amount= Price x Quantity) vs Volume (Quantity only)
GDP measures the value of final goods and services produced.
1. Total Income Earned = 2. Total Money Spent = 3. Total value of Goods and Services
Question: Does an increase in GDP tell us if the economy has grown?
e.g. 2009: £50,000 to 2010: £55,000
Well…….We can’t be sure. It is difficult to say at this point as the increase could be due
to an increase in price level only and the quantity of goods and services produced is the
same as before.
E.g. 2009: £10 x 5000 units = £50,000 2010: £11 x 5000 units = £55,000
This shows the same amount of goods and services - but at higher prices in 2010. So,
the economy has not grown in real terms. It is Just rise in price level and no change in
output. Therefore the same national income in real terms.
Real GDP - Total value of the final goods and services produced in an economy in
one financial year after the adjustment of inflation (i.e. at the constant price level).
7
,Does an increase in real GDP tell us if the economy has grown?
e.g. 2007: £50,000 to 2008: £58,000
Well…….We still can’t be sure, because this increase could be due to an increase in
population only. So we need to use real GDP per capita.
Real GDP per capita - The total value of final goods and services produced in an
economy in one financial year after the adjustment of inflation and population.
Real GDP per capita = Real GDP / Population
If there is an increase in real GDP per capita, then one can be fairly sure that the
economy is growing since the figure is after the adjustment of inflation and population.
GDP vs GNP:
GNP (Gross National Income) = GDP + Net income earned from abroad
Net income earned from abroad - The difference between income earned by citizens
in our country from abroad and the income earned by foreigners in our country.
Overall, GNP includes the total value of G/S produced in the country and out of the
country in one financial year..
Economic growth rate
The % change in real GDP over a period of time. (%= Change/Original x 100)
e.g. 2010 = £50,000 & 2011 = £60,000
Economic Growth Rate =
For example:
Year E.Growth Rate
2018 3%
2019 2%
2020 1%
Is the economy growing or not?
You may think that Economy is declining BUT the economy is growing at a slower rate
each year. (as long as the % rate of growth is positive the economy is always growing)
8
,Does high growth necessarily mean a high SOL?
SOL - Standard of living, i.e. Improvement in the quality of life
Not only ↑GDP can ensure a better quality of life; in economics better SOL = choice,
variety, quality of goods and balance between work & leisure as compared to just
having access to a high income..
↑GDP (growth) → ↑income
But… is it real?
↑income → can afford more
But… per capita?
↑GDP → more choice & variety
But… How many hours had to be worked to earn that money?
Would you like to earn a lot of money to buy lunch but NO LUNCH BREAK?
Overall, SoL can be very subjective as gardening can be work for one but leisure for the
other. SoL also measures happiness; it also varies from one to the other.
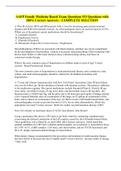
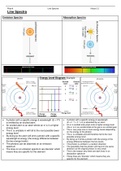
Economic Cycle
Output gap → gap between trend & actual growth
+ve: Actual > trend
-ve: Actual < trend
- Recession: 2 consecutive quarters (6 Months) of negative economic growth.
- Trend growth: expected/forecasted potential increase in real GDP over the period
of time
9
, - Boom: Too high level of demand when actual growth is higher than the trend
growth. It can cause inflationary pressure, i.e. price level may go high.
- Decline/bust: Too low level of demand when actual growth is less than the trend
growth. It can cause deflationary pressure, i.e. price level may go too low.
Productivity Gap: It is NOT same as the output gap
Productivity = output per worker
Productivity gap means the difference between output per worker of an economy with
other major trading partners.
E.g. The UK's productivity gap with France and Germany is widening as our
productivity is not rising as fast as other countries. The reasons behind this could be lack
of capital investment; technological advancement is limited; less money spent on R&D
and innovation.
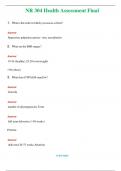
Types of recessions:
V- shaped recession → U-shaped Recession → W-shape → double-dip
Quick recovery Slow Recession & Recovery Recession (fragile growth)
How do you measure Economic Growth Rate?
Ans: % rise in GDP
However… (Evaluation)
● GDP does not take into account inflation
● Population factor is also ignored, i.e. we need real GDP per capita
● Unrecorded/illegal transactions and the quality of life ignored.
● Subsistence production (DIY) production is ignored.
● Distribution of income not considered, i.e. gap between rich and poor
10
, ● Development indicators are better than raw GDP figures.
● A double counting error i.e. when a product is counted more than once e.g. yarn,
cloth and shirts all are counted in the GDP instead of the final goods only such as
value of shirts (shirts include cloth and cloth includes the yarn)
● Biased survey and data collection could have errors.
Purchasing power parity
The alternative to using market exchange rates is to use purchasing power parities (PPPs). The
purchasing power of a currency refers to the quantity of the currency needed to purchase a
given unit of a good, or common basket of goods and services. Purchasing power is clearly
determined by the relative cost of living and inflation rates in different countries. Purchasing
power parity means equalising the purchasing power of two currencies by taking into account
these cost of living and inflation differences. It is expressed in a common currency to compare
standard of living between two countries.
For example, if we convert GDP in Japan to US dollars using market exchange rates, relative
purchasing power is not taken into account, and the validity of the comparison is weakened. By
adjusting rates to take into account local purchasing power differences, known as PPP adjusted
exchange rates, international comparisons are more valid.
11
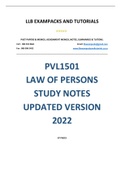
,Inflation
Inflation means an increase in average general price level, and cost of living becomes
expensive if real income remains the same and the SoL is likely to fall .
Inflation usually decreases the value of money in the domestic market, e.g. £10.00 is not
worth £10.00 anymore as you can not afford to buy the same quantity of goods or
services with the given money.
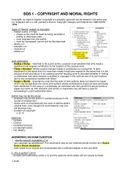
Year Inflation ● Prices are rising every year except 2014 (deflation).
rate ● Year 2009 → 2010: disinflation, i.e. prices are rising at a
slower rate.
2009 3% ● Year 2013: prices are meant to be at the highest since 2009
since prices have been rising throughout.
2010 2%
2011 0.5% If prices rise faster than 3% p.a. there is a fear of hyperinflation. If
prices are rising at less than 1%, there is a fear of deflation, i.e.
2012 1% prices may fall further and may bring recession.
2013 0.2% Usually the deflation is worse than low inflation: deflation →
postpone spending → ↓growth and may bring recession.
2014 -0.2%
How do we measure inflation?
Basket of goods method: Survey of 7000 average families - Basket includes 650-800
goods used by those families. If the basket price increases over time, that reflects
inflation in the economy. It can be expressed by index:
Current index can be calculated as RPI, CPI, CPIH
RPI (retail price index): Calculated as a standard basket of goods method; UK doesn’t
use RPI anymore as target to control inflation.
CPI (consumer price index): A weighted basket, i.e. when weights are provided on the
goods and services on the basis of their importance. It means essential goods are
provided more value/weight than non-essential goods, e.g. milk vs wine. Also, CPI,
unlike RPI, excludes mortgage interest repayment i.e. housing cost.
14
,How are weights provided?
The Family expenditure survey i.e. % of household income spent by households on
goods and services. e.g. gas and electricity may take a larger % of income as compared
to toilet tissues.
NOTE: The basket of goods and services is regularly updated to reflect the true cost of
living for the average families e.g. CD Players are taken off the basket and electric
scooters are added in the basket to reflect the latest trend in the economy.
S&C: RPIx = RPI - Mortgage interest repayment; RPIy - RPIx - Net indirect tax (VAT)
Bank of England Target: 2% inflation of CPI +/- 1% (MPC Monetary Policy
Committee is responsible to achieve the low inflation target in the UK Economy)
RPI and/or CPI do not always reflect the true picture and can not be trusted blindly. In
other words limitations of the RPI and CPI:
However…
● Only 650-800 goods & used by only 7000 families.
● Only average families: no students, pensioners or too rich/poor.
● Not everybody uses the same goods.
● Taste/preference may change over time.
● Only average price is considered and it ignores improvement in quality of goods.
15
,16
, Unemployment
When people are able, available and actively looking for a job for the last four weeks
and ready to start within the next 2 weeks but having NO job.
How to measure the level of unemployment:
-JSA, i.e. job seekers allowance, i.e. claimant count (how many people are claiming
benefits)
-LFS, i.e. labour force survey, organised by ILO (international labour organisation) :
ILO conducts a survey of 60,000 randomly picked households to find out how many
people are able and available and actively looking for a job.
However… (JSA)
● Fraud seekers - people who work and claim benefits too
● Pride issues - too proud to claim benefits
● Eligibility criteria, i.e. if house income is >£35,000 (varies) - can’t claim; Must
be over 18; if bank savings are > £5000 (varies) - can’t claim benefits.
However… (ILO)
● Only 60,000 households
● Biased - survey
● Outdated information - when findings are published (time-lag)
Quiz:
A. 40 workers unemployed → 20 weeks
B. 20 workers unemployed → 40 weeks
-A is better
- B is better
-Both same
Output point of view → both are same (20 x 40 or 40 x 20)
However, option A is better than other options since shorter time of unemployment is
better than longer time. The longer time of unemployment makes individuals deskilled
and retraining costs could be really high. Also, fear of getting out of the workforce due
to hysteresis effects. In practice, It has been seen that after recession redundant people
are less likely to be hired as compared to freshly skilled graduates.
N.B. workers may be reluctant to go back; employers may be reluctant to take workers.
17
Key terminology differences between Micro and Macroeconomics:
Micro (Unit 1) to Macro (Unit 2)
Price - Price level
Quantity - Real output
Demand - Aggregate demand
Supply - Aggregate supply
Small i.e. individual - Large i.e. economy as a whole
Macroeconomics can be studied at a national, international and global level. While
studying macroeconomics, we consider the economy as a whole, rather than individuals,
firms (single) or individual products.
Macroeconomic objective or the performance indicators:
The key macroeconomic objectives to remember are “BIIG BUSS”
● Balanced Budget (Government spending = Tax revenue)
● Inflation - (Price level to be low)
● Inequality - (To be low so that there is a narrow gap between the rich and poor)
● Growth - (Steady Economic growth)
● Balance of payment - (To be satisfactory BOP i.e. £ Inflow= £Outflow)
● Unemployment - (To be low)
● Standard of Living- (Improvement in quality of life and the material well-being)
● Sustainability & Stability- (No over-utilisation of scarce resources); Stability
(Avoid volatility/fluctuations in economic activities & achieving BIIG BUSS)
6
,Economic growth: (Key Objective)
In the short run, increase in (real) GDP and in the long run, improvement in the
productive capacity and potential.
GDP (Gross domestic product) - The total value of the final goods and services
produced in an economy in one financial year.
Value (£Amount= Price x Quantity) vs Volume (Quantity only)
GDP measures the value of final goods and services produced.
1. Total Income Earned = 2. Total Money Spent = 3. Total value of Goods and Services
Question: Does an increase in GDP tell us if the economy has grown?
e.g. 2009: £50,000 to 2010: £55,000
Well…….We can’t be sure. It is difficult to say at this point as the increase could be due
to an increase in price level only and the quantity of goods and services produced is the
same as before.
E.g. 2009: £10 x 5000 units = £50,000 2010: £11 x 5000 units = £55,000
This shows the same amount of goods and services - but at higher prices in 2010. So,
the economy has not grown in real terms. It is Just rise in price level and no change in
output. Therefore the same national income in real terms.
Real GDP - Total value of the final goods and services produced in an economy in
one financial year after the adjustment of inflation (i.e. at the constant price level).
7
,Does an increase in real GDP tell us if the economy has grown?
e.g. 2007: £50,000 to 2008: £58,000
Well…….We still can’t be sure, because this increase could be due to an increase in
population only. So we need to use real GDP per capita.
Real GDP per capita - The total value of final goods and services produced in an
economy in one financial year after the adjustment of inflation and population.
Real GDP per capita = Real GDP / Population
If there is an increase in real GDP per capita, then one can be fairly sure that the
economy is growing since the figure is after the adjustment of inflation and population.
GDP vs GNP:
GNP (Gross National Income) = GDP + Net income earned from abroad
Net income earned from abroad - The difference between income earned by citizens
in our country from abroad and the income earned by foreigners in our country.
Overall, GNP includes the total value of G/S produced in the country and out of the
country in one financial year..
Economic growth rate
The % change in real GDP over a period of time. (%= Change/Original x 100)
e.g. 2010 = £50,000 & 2011 = £60,000
Economic Growth Rate =
For example:
Year E.Growth Rate
2018 3%
2019 2%
2020 1%
Is the economy growing or not?
You may think that Economy is declining BUT the economy is growing at a slower rate
each year. (as long as the % rate of growth is positive the economy is always growing)
8
,Does high growth necessarily mean a high SOL?
SOL - Standard of living, i.e. Improvement in the quality of life
Not only ↑GDP can ensure a better quality of life; in economics better SOL = choice,
variety, quality of goods and balance between work & leisure as compared to just
having access to a high income..
↑GDP (growth) → ↑income
But… is it real?
↑income → can afford more
But… per capita?
↑GDP → more choice & variety
But… How many hours had to be worked to earn that money?
Would you like to earn a lot of money to buy lunch but NO LUNCH BREAK?
Overall, SoL can be very subjective as gardening can be work for one but leisure for the
other. SoL also measures happiness; it also varies from one to the other.
Economic Cycle
Output gap → gap between trend & actual growth
+ve: Actual > trend
-ve: Actual < trend
- Recession: 2 consecutive quarters (6 Months) of negative economic growth.
- Trend growth: expected/forecasted potential increase in real GDP over the period
of time
9
, - Boom: Too high level of demand when actual growth is higher than the trend
growth. It can cause inflationary pressure, i.e. price level may go high.
- Decline/bust: Too low level of demand when actual growth is less than the trend
growth. It can cause deflationary pressure, i.e. price level may go too low.
Productivity Gap: It is NOT same as the output gap
Productivity = output per worker
Productivity gap means the difference between output per worker of an economy with
other major trading partners.
E.g. The UK's productivity gap with France and Germany is widening as our
productivity is not rising as fast as other countries. The reasons behind this could be lack
of capital investment; technological advancement is limited; less money spent on R&D
and innovation.
Types of recessions:
V- shaped recession → U-shaped Recession → W-shape → double-dip
Quick recovery Slow Recession & Recovery Recession (fragile growth)
How do you measure Economic Growth Rate?
Ans: % rise in GDP
However… (Evaluation)
● GDP does not take into account inflation
● Population factor is also ignored, i.e. we need real GDP per capita
● Unrecorded/illegal transactions and the quality of life ignored.
● Subsistence production (DIY) production is ignored.
● Distribution of income not considered, i.e. gap between rich and poor
10
, ● Development indicators are better than raw GDP figures.
● A double counting error i.e. when a product is counted more than once e.g. yarn,
cloth and shirts all are counted in the GDP instead of the final goods only such as
value of shirts (shirts include cloth and cloth includes the yarn)
● Biased survey and data collection could have errors.
Purchasing power parity
The alternative to using market exchange rates is to use purchasing power parities (PPPs). The
purchasing power of a currency refers to the quantity of the currency needed to purchase a
given unit of a good, or common basket of goods and services. Purchasing power is clearly
determined by the relative cost of living and inflation rates in different countries. Purchasing
power parity means equalising the purchasing power of two currencies by taking into account
these cost of living and inflation differences. It is expressed in a common currency to compare
standard of living between two countries.
For example, if we convert GDP in Japan to US dollars using market exchange rates, relative
purchasing power is not taken into account, and the validity of the comparison is weakened. By
adjusting rates to take into account local purchasing power differences, known as PPP adjusted
exchange rates, international comparisons are more valid.
11
,Inflation
Inflation means an increase in average general price level, and cost of living becomes
expensive if real income remains the same and the SoL is likely to fall .
Inflation usually decreases the value of money in the domestic market, e.g. £10.00 is not
worth £10.00 anymore as you can not afford to buy the same quantity of goods or
services with the given money.
Year Inflation ● Prices are rising every year except 2014 (deflation).
rate ● Year 2009 → 2010: disinflation, i.e. prices are rising at a
slower rate.
2009 3% ● Year 2013: prices are meant to be at the highest since 2009
since prices have been rising throughout.
2010 2%
2011 0.5% If prices rise faster than 3% p.a. there is a fear of hyperinflation. If
prices are rising at less than 1%, there is a fear of deflation, i.e.
2012 1% prices may fall further and may bring recession.
2013 0.2% Usually the deflation is worse than low inflation: deflation →
postpone spending → ↓growth and may bring recession.
2014 -0.2%
How do we measure inflation?
Basket of goods method: Survey of 7000 average families - Basket includes 650-800
goods used by those families. If the basket price increases over time, that reflects
inflation in the economy. It can be expressed by index:
Current index can be calculated as RPI, CPI, CPIH
RPI (retail price index): Calculated as a standard basket of goods method; UK doesn’t
use RPI anymore as target to control inflation.
CPI (consumer price index): A weighted basket, i.e. when weights are provided on the
goods and services on the basis of their importance. It means essential goods are
provided more value/weight than non-essential goods, e.g. milk vs wine. Also, CPI,
unlike RPI, excludes mortgage interest repayment i.e. housing cost.
14
,How are weights provided?
The Family expenditure survey i.e. % of household income spent by households on
goods and services. e.g. gas and electricity may take a larger % of income as compared
to toilet tissues.
NOTE: The basket of goods and services is regularly updated to reflect the true cost of
living for the average families e.g. CD Players are taken off the basket and electric
scooters are added in the basket to reflect the latest trend in the economy.
S&C: RPIx = RPI - Mortgage interest repayment; RPIy - RPIx - Net indirect tax (VAT)
Bank of England Target: 2% inflation of CPI +/- 1% (MPC Monetary Policy
Committee is responsible to achieve the low inflation target in the UK Economy)
RPI and/or CPI do not always reflect the true picture and can not be trusted blindly. In
other words limitations of the RPI and CPI:
However…
● Only 650-800 goods & used by only 7000 families.
● Only average families: no students, pensioners or too rich/poor.
● Not everybody uses the same goods.
● Taste/preference may change over time.
● Only average price is considered and it ignores improvement in quality of goods.
15
,16
, Unemployment
When people are able, available and actively looking for a job for the last four weeks
and ready to start within the next 2 weeks but having NO job.
How to measure the level of unemployment:
-JSA, i.e. job seekers allowance, i.e. claimant count (how many people are claiming
benefits)
-LFS, i.e. labour force survey, organised by ILO (international labour organisation) :
ILO conducts a survey of 60,000 randomly picked households to find out how many
people are able and available and actively looking for a job.
However… (JSA)
● Fraud seekers - people who work and claim benefits too
● Pride issues - too proud to claim benefits
● Eligibility criteria, i.e. if house income is >£35,000 (varies) - can’t claim; Must
be over 18; if bank savings are > £5000 (varies) - can’t claim benefits.
However… (ILO)
● Only 60,000 households
● Biased - survey
● Outdated information - when findings are published (time-lag)
Quiz:
A. 40 workers unemployed → 20 weeks
B. 20 workers unemployed → 40 weeks
-A is better
- B is better
-Both same
Output point of view → both are same (20 x 40 or 40 x 20)
However, option A is better than other options since shorter time of unemployment is
better than longer time. The longer time of unemployment makes individuals deskilled
and retraining costs could be really high. Also, fear of getting out of the workforce due
to hysteresis effects. In practice, It has been seen that after recession redundant people
are less likely to be hired as compared to freshly skilled graduates.
N.B. workers may be reluctant to go back; employers may be reluctant to take workers.
17