Cassidy Jackson (1083279)
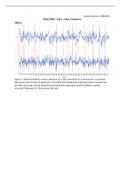
GEOG 3000 – Lab 3 – Flow Turbulence
Figures
Figure 1. Residual velocity in the x-direction (u’) and y-direction (v’) measured in a racetrack
flume over one minute at speed one. The solid red vertical lines represent points at which an
ejection occurred, and the dashed red vertical lines represent points at which a sweep
occurred. Measured at 14cm above the bed.