📊
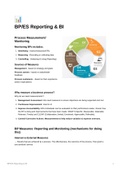
BP/ES Reporting & BI
Process Measurement/
Monitoring
Monitoring BPs includes:
1. Identifying - metrics/measures/KPIs
2. Measuring - Recording or collecting data
3. Controlling - Analysing & Using (Reporting)
Sources of Measures
Management - based on strategy and goals
Process owners - based on stakeholder
feedback
Process customers – based on their experience
and/or expectations
Why measure a business process?
Why do we need measurements?:
1. Management Assessment: We need measures to ensure objectives are being supported and met
2. Continuous Improvement: Used to id
3. Improve Accountability: BPs/ individuals can be evaluated on their performance easier. Assess how
the BP is doing and improvements that have been made. SMART (Specific, Measurable, Attainable,
Relevant, Timely) and CLEAR (Collaborative, limited, Emotional, Appreciable, Refinable).
4. Control/ Corrective Actions: Measurements to help reduce variation & expense overruns.
BP Measures: Reporting and Monitoring (mechanisms for doing
this)
Interval vs External Measures
→ Results that are achieved by a process. The effectiveness, the outcome of the process. How good is
your product/ service.
BP/ES Reporting & BI 1
, a. External measures (measures from the outside) ~ results achieved by a process or value chain
(process effectiveness). How effectively is the process meeting its objectives.
i. Examples: Income measures, Measures of customer satisfaction, Market growth measures,
Stockholder satisfaction.
b. Internal measures ~ how the process is working internally, how many people/ time are working on
the process (process efficiency). how are you going to get there?
i. Examples: Efficiency and effectiveness of specific functions or subprocesses, Costs of p
→ Need to first “lock down” the external measures, then you can begin to focus on improving your internal
measures. Improve internal measures without compromising external.
→ Ultimately, we judge the success or failure of a process by external results.
→ It’s usually easier to define or measure internal metrics than to measure external results.
Leading & Lagging Indicators
Leading indicators/measures – measure/report something that that can change course of events. Track
things you can influence/ change/ adjust. Monitoring on an ongoing basis. measures that report on
situations that are causally related to outcomes that you desire. ie, number of sales we are making.
Adress it now and not at the end. Monitor, drive strategy in a present situation.
Lagging indicators/measures - report on a situation that one hardly/no-longer influences. Historical -
that happened in the past & can’t be changed. ie, Financial statements from last year. Nothing you can
do.
→ Ensure you have a good balance of leading & Lagging indicators.
ie: the company will increase its sales by 15% each quarter of the year. You can wait till the end of the
quarter and then determine how many Widgets you sold. That measure, however, is a lagging indicator.
Once the quarter is over, you won’t be able to do anything about the number of sales you made during the
quarter. You’ll know if you achieved your goal or not, but you won’t be in any position to change the
results.
ie, If you know that your salespeople are scheduled to make 100 sales calls this quarter, you can predict
that you will be making about 20 sales. Thus, sales calls scheduled is a leading indicator of successful
sales.
BP/ES Reporting & BI 2