Biostatistics
Lecture 0
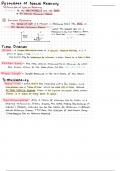
Data collection
• Cross-sectionally
o Data collected at one point in time
• Prospectively
o Start at baseline, outcome in future
o Randomized Controlled Trial (RCT)
o Longitudinal / observational study
• Retrospectively
o Outcome has been assessed
o Looking back in time
o Existing database
Types of data
Lecture 1&2 is continuous data, 3 = binary data, 4 = survival data.
1. Descriptive statistics
− Summarize and describe important features of the data
− Graphics: histogram, boxplot, scatter plot
− Numerical summary measures: mean, median, SD, percentage
2. Inferential statistics
− Draw a conclusion beyond your data sample
− Effect size (mean difference), confidence interval, hypothesis testing
Descriptive statistics
Shapes of distribution
Median = order the observations from low to high and take the middle value.
,If the distribution is right-skewed, then the mean > median. There is a high frequency in the low (left)
area, so the median will be here. The mean is more to the right (higher area) since there are a few
observations that drag the mean to the right.
Measures of spread:
SD, Variance (= SD2), Range (maximum – minimum or begin till the end), IQR (interquartile range =
Q3 – Q1).
Fat line = median. Grey = Q1 and Q3.
Sigma = standard deviation. 2x SD away from mean → ~95% of data
Central limit theorem = the more dices you throw, the more your distribution becomes normal.
Scatter Plot of bivariate (2 variables) data:
,Inferential statistics
If you want to know how reliable an obtained mean is, you can use the standard error (uncertainty)
Higher SD means higher Standard Error (SE). The more people observed (n), the lower the SE.
➔ 95% confidence interval (CI) = mean + or - 1.96 x SEmean
In this case: 95% CI = 1.59 (mean) +/- 1.96 x 0.012 = [1.57; 1.61]. This is the 95% CI.
This was continuous data but you can also use binary data:
, Diagnostic testing
Sensitivity = the chance that a case is correctly identified as positive.
Positive cases : cases (127 : 130 = 97.7%)
Specificity = the chance that a control is correctly identified as negative.
Negative controls : controls (848 : 870 = 97.5%).
Positive Predictive Value (PPV) = positive cases : positives (127 : 149 = 85.2%).
Negative Predictive Value (NPV) = negative controls : negatives (848 : 851 = 99.6%).
The NPV is higher since there are more people that are negative for corona (higher n). these 22 mess
up the outcome for the PPV. It has a higher impact there since there are less people that are positive.
When a disease is not so prevalent in a population, the PPV is often lower than the NPV.
0.852 = positive cases : positives = PPV.
149 was the total number of positives.
Lecture 0
Data collection
• Cross-sectionally
o Data collected at one point in time
• Prospectively
o Start at baseline, outcome in future
o Randomized Controlled Trial (RCT)
o Longitudinal / observational study
• Retrospectively
o Outcome has been assessed
o Looking back in time
o Existing database
Types of data
Lecture 1&2 is continuous data, 3 = binary data, 4 = survival data.
1. Descriptive statistics
− Summarize and describe important features of the data
− Graphics: histogram, boxplot, scatter plot
− Numerical summary measures: mean, median, SD, percentage
2. Inferential statistics
− Draw a conclusion beyond your data sample
− Effect size (mean difference), confidence interval, hypothesis testing
Descriptive statistics
Shapes of distribution
Median = order the observations from low to high and take the middle value.
,If the distribution is right-skewed, then the mean > median. There is a high frequency in the low (left)
area, so the median will be here. The mean is more to the right (higher area) since there are a few
observations that drag the mean to the right.
Measures of spread:
SD, Variance (= SD2), Range (maximum – minimum or begin till the end), IQR (interquartile range =
Q3 – Q1).
Fat line = median. Grey = Q1 and Q3.
Sigma = standard deviation. 2x SD away from mean → ~95% of data
Central limit theorem = the more dices you throw, the more your distribution becomes normal.
Scatter Plot of bivariate (2 variables) data:
,Inferential statistics
If you want to know how reliable an obtained mean is, you can use the standard error (uncertainty)
Higher SD means higher Standard Error (SE). The more people observed (n), the lower the SE.
➔ 95% confidence interval (CI) = mean + or - 1.96 x SEmean
In this case: 95% CI = 1.59 (mean) +/- 1.96 x 0.012 = [1.57; 1.61]. This is the 95% CI.
This was continuous data but you can also use binary data:
, Diagnostic testing
Sensitivity = the chance that a case is correctly identified as positive.
Positive cases : cases (127 : 130 = 97.7%)
Specificity = the chance that a control is correctly identified as negative.
Negative controls : controls (848 : 870 = 97.5%).
Positive Predictive Value (PPV) = positive cases : positives (127 : 149 = 85.2%).
Negative Predictive Value (NPV) = negative controls : negatives (848 : 851 = 99.6%).
The NPV is higher since there are more people that are negative for corona (higher n). these 22 mess
up the outcome for the PPV. It has a higher impact there since there are less people that are positive.
When a disease is not so prevalent in a population, the PPV is often lower than the NPV.
0.852 = positive cases : positives = PPV.
149 was the total number of positives.