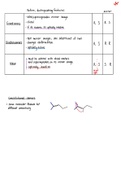
Phase diagrams
- phase changes can be brought on by:
- change in temp
- change in pressure
- a phase diagram shows the combination of temp and
pressure when a substance will be a liquid, solid or gas.
- also shows conditions of temp and pressure that
produce equilibrium between phases
major features of a phase diagram
-phase diagram for water
0A
CO
regions
- 3 regions: solid, liquid, gas
- each point within region in phase diagram represents
conditions where that particular phase is stable
lines
- lines in a phase diagram identify the conditions under
which 2 phases exist at equilibrium
- line ab (vaporization curve) represents combination
of temp and pressure which there can be equilibrium between
liquid and vapor phases
, - line AC (sublimation curve) represents conditions for
solid-vapor equilibrium
- line ad (fusion line) liquid-solid equilibrium.
- diagram above is not to scale, can’t interpolate
the triple point
- point a represents condition where all 3 phases can
coexist at the same time
navigation within phase diagram
- we can represent change in temp or pressure of a sample
of water as movement within the phase diagram
-a change in temp at constant pressure can be
represented by a horizontal line
- a block of ice initially I s at -25c and 1 atm. As temp
increases under same pressure,we can see the change
of the sample by following horizontal line 1:
melting point -0 liquid boiling point -0 gas
→
solid ☐ '
lines / veptkalllhlchangeinpat
temp fixed
i
'
i
water . ji i - - - -
line / Chorlton
-191
☆
oMY☆ i
lineata
I
fixed
pressure)
'
0.003 É - -
11kg2
-
-
-
- - -
-
- -
- - -
-
- -
*
affixedpressure
40.003 Atm
- a block of ice initially at -25c and 0.003 atm. As temp
increases under same pressure, we can see change of
sample by rolling horizontal line 2:
solid-0 /sublimation point
gas