Lean Six Sigma Green Belt
Analyse-fase
Skoledo 1
,Inhoudsopgave
Analyse-fase .....................................................................................................................3
Kenmerken van de dataset: normale verdeling ......................................................................... 4
Is het proces statistische beheerst? .......................................................................................... 5
Regelkaarten (Control Charts) .................................................................................................. 6
Voldoet het proces aan de VOC? (Process Capability) .............................................................. 11
Procesanalyse: wat zijn de invloedsfactoren? ......................................................................... 11
Histogram .............................................................................................................................. 11
Boxplot.................................................................................................................................. 13
Multi-vari chart...................................................................................................................... 13
Spreidingsdiagram ................................................................................................................. 14
Pareto-analyse....................................................................................................................... 15
VSM ...................................................................................................................................... 15
7 verspillingen ....................................................................................................................... 16
Spaghetti-diagram ................................................................................................................. 17
Flowchart .............................................................................................................................. 17
Het GAP-model ...................................................................................................................... 18
Visgraatdiagram..................................................................................................................... 18
5xWhy ................................................................................................................................... 19
FMEA ..................................................................................................................................... 19
TOC ....................................................................................................................................... 20
Hypothesetoetsing, wat is dat? .............................................................................................. 21
Hypothesetoetsen, wanneer kun je welke toets gebruiken? .................................................... 21
Eensteeksproef T-toets .......................................................................................................... 21
Two Sample T-toets en Mann Whitney toets .......................................................................... 22
ANOVA .................................................................................................................................. 23
Chi Square ............................................................................................................................. 23
Proportietoetsen ................................................................................................................... 23
Regressie-analyse .................................................................................................................. 24
Outputs Analyse-fase ............................................................................................................. 25
Skoledo 2
, Analyse-fase
De derde stap van de DMAIC is de Analyse-fase. In deze fase ga je processen analyseren aan
de hand van enkele vragen en met behulp van analysetools.
De outputs van deze fase kunnen zijn:
1. Een dataset;
2. Een berekening van het DPMO, Z-waarde, Sigmaniveau, Cp & Cpk van het proces;
3. Een Control chart van het proces;
4. Histogrammen, boxplotten, scatterplots en multi-vari charts;
5. Een analysedocument met daarin bijvoorbeeld een visgraat-analyse, 5xwhy, gap-
analyse;
6. Een FMEA;
7. Een lijst met knelpunten/ invloedsfactoren;
8. Een geformuleerde hypothese;
9. Een uitgevoerde hypothese-toets;
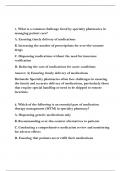
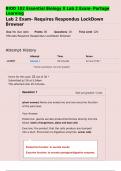
Figuur 1 Onderwerpen Analyse-fase
Skoledo 3
Analyse-fase
Skoledo 1
,Inhoudsopgave
Analyse-fase .....................................................................................................................3
Kenmerken van de dataset: normale verdeling ......................................................................... 4
Is het proces statistische beheerst? .......................................................................................... 5
Regelkaarten (Control Charts) .................................................................................................. 6
Voldoet het proces aan de VOC? (Process Capability) .............................................................. 11
Procesanalyse: wat zijn de invloedsfactoren? ......................................................................... 11
Histogram .............................................................................................................................. 11
Boxplot.................................................................................................................................. 13
Multi-vari chart...................................................................................................................... 13
Spreidingsdiagram ................................................................................................................. 14
Pareto-analyse....................................................................................................................... 15
VSM ...................................................................................................................................... 15
7 verspillingen ....................................................................................................................... 16
Spaghetti-diagram ................................................................................................................. 17
Flowchart .............................................................................................................................. 17
Het GAP-model ...................................................................................................................... 18
Visgraatdiagram..................................................................................................................... 18
5xWhy ................................................................................................................................... 19
FMEA ..................................................................................................................................... 19
TOC ....................................................................................................................................... 20
Hypothesetoetsing, wat is dat? .............................................................................................. 21
Hypothesetoetsen, wanneer kun je welke toets gebruiken? .................................................... 21
Eensteeksproef T-toets .......................................................................................................... 21
Two Sample T-toets en Mann Whitney toets .......................................................................... 22
ANOVA .................................................................................................................................. 23
Chi Square ............................................................................................................................. 23
Proportietoetsen ................................................................................................................... 23
Regressie-analyse .................................................................................................................. 24
Outputs Analyse-fase ............................................................................................................. 25
Skoledo 2
, Analyse-fase
De derde stap van de DMAIC is de Analyse-fase. In deze fase ga je processen analyseren aan
de hand van enkele vragen en met behulp van analysetools.
De outputs van deze fase kunnen zijn:
1. Een dataset;
2. Een berekening van het DPMO, Z-waarde, Sigmaniveau, Cp & Cpk van het proces;
3. Een Control chart van het proces;
4. Histogrammen, boxplotten, scatterplots en multi-vari charts;
5. Een analysedocument met daarin bijvoorbeeld een visgraat-analyse, 5xwhy, gap-
analyse;
6. Een FMEA;
7. Een lijst met knelpunten/ invloedsfactoren;
8. Een geformuleerde hypothese;
9. Een uitgevoerde hypothese-toets;
Figuur 1 Onderwerpen Analyse-fase
Skoledo 3