Task 2
C216 MBA Capstone Task 2: T.K. Sensors Performance Evaluation
C216 MBA Capstone
Task 2: T.K. Sensors Performance
Evaluation Name
Name
Name
Name
1 2D. 1. Analyze your performance for three of the eight years in comparison to one of your
competitors.
Erie (T.K. Sensors) vs. Ferris (Competition) Years: Six (2024), Seven (2025), and Eight (2026)
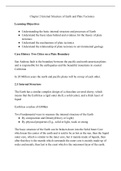
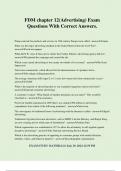
Return on Sales (ROS): Also referred to as the Net Profit Margin ; Return on Sales determines the net income acquired for every dollar generated from sales. To calculate ROS, net income is divided by net sales. During the final three years of operation, Erie generated a higher Return on Sales than our competitor Ferris, as shown in the chart below. Erie’s ROS was
considerably higher than Ferris for the final three rounds of competition, but was unstable in comparison to Ferris,’ small but steady, increments. With data retrieved from the Capstone Courier, Ferris’ leading cause of mediocre ROS was high labor and material costs that created a minimal profit margin.
The substantial decline in ROS Erie faced in 2025 was purely the consequences of the mishandlings of our traditional product Echo. At T.K. Sensors inception, Echo was our high end sensor. Since customer buying criteria called for an age of 0 for high end sensors, it was impossible to reach that benchmark with an established product. It was decided that Echo would become a traditional product due to the success of our other traditional sensor Eat. Echo’s automation reached 7.5, which made it impossible for Research and Development to adjust the buying criteria and revision date to make a successful product. Echo was creating financial havoc
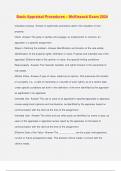
for T.K. Sensors and it was essential to end its production. After Echo’s demise, T.K. sensors was able to recover in year eight and bring ROS to 12.21% at the end of 2026. 3Return on Assets (ROA): Return on Assets is a profitability ratio that is calculated by dividing net income by the total value of assets. Some examples of assets owned by a traditional business are as follows: inventory, cash, vehicles, plants, machinery, and equipment. ROA measures the percentage of every dollar contributed into the company that returns a profit. Assets
are compared to how much profit was generated during the same year’s operation to demonstrate
how efficient your company was at utilizing those assets to cultivate a profit.
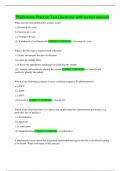
In comparison to Ferris, Erie was able to harvest a higher ROA on all three of the final years of competition. In Erie’s worst year, 2025 (Year 7), we had $0 of cash in hand in comparison to Ferris’ $36,299. The lack of currency, an emergency loan, and excess inventory of
$34,607 contributed to T.K. Sensors ROA to reach a meager 2.77% for year 7. One area Erie excelled, was maintaining relatively low variable costs in comparison to the other five organizations. In hindsight we should have kept fewer inventories from year to year and saved a tremendous amount of money by discontinuing Echo in round four. Echo’s drain on finances negatively affected Erie’s bottom line. Unlike Ferris, Erie had difficulty in generating high sales numbers. Ferris had an extensive advantage on Erie with 40% higher in sales revenue but failed to use their revenue effectively. From 2024 to 2026 Ferris had a greater amount of cash, low amount of account receivables, and limited plant and equipment. Ferris failed to capitalize a high
ROA because it retained excessive amounts of cash instead of investing in research & development and production.
C216 MBA Capstone Task 2: T.K. Sensors Performance Evaluation
C216 MBA Capstone
Task 2: T.K. Sensors Performance
Evaluation Name
Name
Name
Name
1 2D. 1. Analyze your performance for three of the eight years in comparison to one of your
competitors.
Erie (T.K. Sensors) vs. Ferris (Competition) Years: Six (2024), Seven (2025), and Eight (2026)
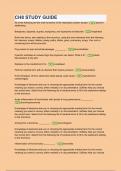
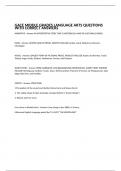
Return on Sales (ROS): Also referred to as the Net Profit Margin ; Return on Sales determines the net income acquired for every dollar generated from sales. To calculate ROS, net income is divided by net sales. During the final three years of operation, Erie generated a higher Return on Sales than our competitor Ferris, as shown in the chart below. Erie’s ROS was
considerably higher than Ferris for the final three rounds of competition, but was unstable in comparison to Ferris,’ small but steady, increments. With data retrieved from the Capstone Courier, Ferris’ leading cause of mediocre ROS was high labor and material costs that created a minimal profit margin.
The substantial decline in ROS Erie faced in 2025 was purely the consequences of the mishandlings of our traditional product Echo. At T.K. Sensors inception, Echo was our high end sensor. Since customer buying criteria called for an age of 0 for high end sensors, it was impossible to reach that benchmark with an established product. It was decided that Echo would become a traditional product due to the success of our other traditional sensor Eat. Echo’s automation reached 7.5, which made it impossible for Research and Development to adjust the buying criteria and revision date to make a successful product. Echo was creating financial havoc
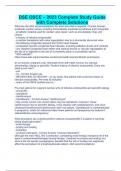
for T.K. Sensors and it was essential to end its production. After Echo’s demise, T.K. sensors was able to recover in year eight and bring ROS to 12.21% at the end of 2026. 3Return on Assets (ROA): Return on Assets is a profitability ratio that is calculated by dividing net income by the total value of assets. Some examples of assets owned by a traditional business are as follows: inventory, cash, vehicles, plants, machinery, and equipment. ROA measures the percentage of every dollar contributed into the company that returns a profit. Assets
are compared to how much profit was generated during the same year’s operation to demonstrate
how efficient your company was at utilizing those assets to cultivate a profit.
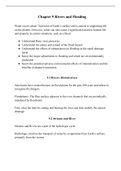
In comparison to Ferris, Erie was able to harvest a higher ROA on all three of the final years of competition. In Erie’s worst year, 2025 (Year 7), we had $0 of cash in hand in comparison to Ferris’ $36,299. The lack of currency, an emergency loan, and excess inventory of
$34,607 contributed to T.K. Sensors ROA to reach a meager 2.77% for year 7. One area Erie excelled, was maintaining relatively low variable costs in comparison to the other five organizations. In hindsight we should have kept fewer inventories from year to year and saved a tremendous amount of money by discontinuing Echo in round four. Echo’s drain on finances negatively affected Erie’s bottom line. Unlike Ferris, Erie had difficulty in generating high sales numbers. Ferris had an extensive advantage on Erie with 40% higher in sales revenue but failed to use their revenue effectively. From 2024 to 2026 Ferris had a greater amount of cash, low amount of account receivables, and limited plant and equipment. Ferris failed to capitalize a high
ROA because it retained excessive amounts of cash instead of investing in research & development and production.