Student Exploration: Distance-Time Velocity and Velocity-Time Graphs
Prior Knowledge Questions (Do these BEFORE using the
Gizmo.)
Dora runs one lap around the track, finishing where she started.
Clark runs a 100-meter dash along the straight side of the track.
1. Which runner traveled a greater distance?
Dora
2. Which runner had a greater change in position, start to finish?
Clark
Gizmo Warm-up
The Distance-Time Graphs Gizmo shows a dynamic graph of the position of a runner over time.
The Distance-Time and Velocity-Time Graphs Gizmo includes that same graph and adds two
new ones: a velocity vs. time graph and a distance traveled vs. time graph. The graph shown
below (and in the Gizmo) shows a runner’s position (or distance from the starting line) over time.
This is most commonly called a position-time graph.
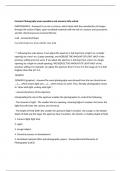
Check that the Number of Points is 2. Turn on Show
graph and Show animation for both Runner 1 and
Runner 2.
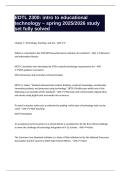
1. Drag the points to create the graph shown to the right.
● Runner 1’s line (the red one) should have
endpoints at (0, 0) and (4, 40).
● Runner 2’s line (the blue one) should have
endpoints at (0, 40) and (4, 20).
2. Click the green Start button on the stopwatch. Watch the two runners carefully. In what two
ways are the runners’ motions different?
One’s displacement is higher and the others distance is higher. But the one that has the
higher displacement had less distance walked.
Page 1 of 8
, Student Exploration: Distance-Time Velocity and Velocity-Time Graphs
Speed is a measure of how fast an object moves, regardless of direction. Speed can never be
negative. Velocity describes both speed and direction, and can be positive or negative.
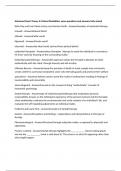
1. In the Gizmo, make a position-time graph for
Runner 1 with the following features:
● There is at least one major change in speed.
● There is at least one major change in
direction.
Click the green Start button and watch the runner
run. Adjust your graph if needed to meet the
requirements.
Sketch your graph to the right. Click on the graph,
then click Edit. Use the sketch tool to draw, then
click Save & Close.
2. Where was the runner each second? Based on your graph, fill in all except the final column in
the table below. (Leave the velocity column blank for now.) Label any numbers with units.
Time Position at end Distance To the left or Velocity this
of time interval moved this right? time interval
(m) time interval (m/s)
(m)
0 - 1 sec 10 10 right 10
1 -2 sec 40 30 right 30
2 - 3 sec 30 10 left -10
3 - 4 sec 20 10 left -10
Page 2 of 8
Prior Knowledge Questions (Do these BEFORE using the
Gizmo.)
Dora runs one lap around the track, finishing where she started.
Clark runs a 100-meter dash along the straight side of the track.
1. Which runner traveled a greater distance?
Dora
2. Which runner had a greater change in position, start to finish?
Clark
Gizmo Warm-up
The Distance-Time Graphs Gizmo shows a dynamic graph of the position of a runner over time.
The Distance-Time and Velocity-Time Graphs Gizmo includes that same graph and adds two
new ones: a velocity vs. time graph and a distance traveled vs. time graph. The graph shown
below (and in the Gizmo) shows a runner’s position (or distance from the starting line) over time.
This is most commonly called a position-time graph.
Check that the Number of Points is 2. Turn on Show
graph and Show animation for both Runner 1 and
Runner 2.
1. Drag the points to create the graph shown to the right.
● Runner 1’s line (the red one) should have
endpoints at (0, 0) and (4, 40).
● Runner 2’s line (the blue one) should have
endpoints at (0, 40) and (4, 20).
2. Click the green Start button on the stopwatch. Watch the two runners carefully. In what two
ways are the runners’ motions different?
One’s displacement is higher and the others distance is higher. But the one that has the
higher displacement had less distance walked.
Page 1 of 8
, Student Exploration: Distance-Time Velocity and Velocity-Time Graphs
Speed is a measure of how fast an object moves, regardless of direction. Speed can never be
negative. Velocity describes both speed and direction, and can be positive or negative.
1. In the Gizmo, make a position-time graph for
Runner 1 with the following features:
● There is at least one major change in speed.
● There is at least one major change in
direction.
Click the green Start button and watch the runner
run. Adjust your graph if needed to meet the
requirements.
Sketch your graph to the right. Click on the graph,
then click Edit. Use the sketch tool to draw, then
click Save & Close.
2. Where was the runner each second? Based on your graph, fill in all except the final column in
the table below. (Leave the velocity column blank for now.) Label any numbers with units.
Time Position at end Distance To the left or Velocity this
of time interval moved this right? time interval
(m) time interval (m/s)
(m)
0 - 1 sec 10 10 right 10
1 -2 sec 40 30 right 30
2 - 3 sec 30 10 left -10
3 - 4 sec 20 10 left -10
Page 2 of 8