Theme 2: The UK economy – performance and policies
2. 1. Measures of economic performance
2. 1. 1. Economic growth
a. Economic growth: an increase in the productive potential of an economy over a period
of time.
- It can be measured in the rate of change of real Gross Domestic Product (GDP).
- GDP: the total value of all goods and services produced within a country in a given
period of time.
- GDP is usually measured at market prices, meaning that the value of the goods includes
indirect taxes, but does not include the value of subsidies producers may receive.
- Taxes on goods increase market prices without changing output.
- Subsidies reduce prices.
- A more accurate measure of GDP is at factor cost, which subtracts taxes and adds
subsidies.
- Called Gross Value Added
, b.
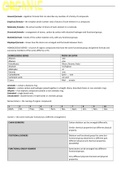
Nominal vs. real Total vs. per capita Value vs. volume
Nominal GDP: the market Total GDP: the total amount Value: calculating the value
value of goods and services of output for the whole (billion pounds) of all the
produced in an economy, country goods and services produced
in one year
unadjusted for inflation.
Real: nominal GDP adjusted Per capita: total GDP divided Volume: adding up the
for inflation to reflect the real by the population quantity of goods and
changes. services produced in one
year.
c. Gross National Income (GNI) and Gross National Product (GNP)
- GNI: GDP + net income paid into the country by other countries
- This means that it adds what a country earns from overseas investments and
subtracts what foreigners earn in a country and send back home from the GDP.
- The net figure for property income could be negative or positive depending on
whether or not a country’s overseas earnings are greater, or smaller than the
earnings of foreign-owned businesses in the country.
- Poorer countries are likely to have a negative net property income as they often
have large investments from TNCs that are attracted by the cheap labour and
low regulation.
- GNP: GDP + income that residents receive from abroad - income claimed by non-
residents
- This means it is the value of all the goods produced by citizens of a country,
whether they live in the country or not.
- Whilst GDP is the value of all goods produced inside the country, whether they
were produced by citizens of the country or not.
d. Comparisons of the rate of growth between countries over time
Over time: changing national incomes will show whether a country has grown or shrunk over a
period of time.
- Data is compared to other countries and put in context. Can be compared to similar
countries to see if it has done well or not.
- The figures also make judgements about economic welfare as growth in national
income means a rise in living standards as consumers have more options.
Between countries: countries have different populations.
- A higher GDP does not necessarily mean better living standards if there is also a higher
population.
, - One must use real, per capita figures. If a country’s population grows over time, then
this may cause a rise in GDP without a rise in living standards and so provide inaccurate
comparisons. We use real GDP to strip out the effect of inflation.
e. Understanding Purchasing Power Parities (PPPs) and the use of PPP adjusted figures in
international comparisons
The market exchange rate might not reflect the purchasing power of a currency compared to
another.
PPPs show how much a basket of goods from one country (in one currency) would cost in a
different country (in a different currency).
- For example, £1 compared to $1.
A Big Mac might be £1 in London but $3 in NY.
This happens with most goods. The Purchasing Power Parity (PPP) rate of exchange is £1 = $3,
meaning that the value of UK GDP in dollars is $6000 billion, not $4000 billion.
In the real world market, exchange rates fluctuate for many reasons and can diverge from PPP
rates. In general, the PPP rates of exchange in developing countries are much higher than
market rates, as prices of goods and services are much lower than in richer countries.
f. The limitations of GDP to compare living standards between countries over time
There are some difficulties when comparing national income figures for a country over some
years:
1. Population change: per capita income is important for comparing living standards
2. Changing distribution of income: can change over time, but is not reflected in per
capita figures
3. Externalities: may increase or decrease, but they are not captured in GDP data
4. Changes in the quality of goods and services: GDP does not capture changes in
quality.
5. Changes in price: important to compare GDP data from different years in terms of
constant prices, not current prices
6. Changes in the size of the shadow economy: the shadow economy gets bigger in a
recession as people lose their jobs and work in the informal economy instead
7. Home produced goods/services: GDP is underestimated
8. Changes in government spending: changing priorities may result in big changes in
where money is spent
9. Changes in investment and consumption: living standards will improve in the short
term if households save less and spend more, but it will harm living standards in the
future
10. Errors in the calculation of inflation: GDP will be inaccurate.
, g. National happiness
UK wellbeing Programme:
● In 2010, the UK Prime Minister launched the Measuring National Wellbeing report to
measure how lives are improving. They found that self-reported health, relationship
status and employment status most affect personal well-being.
● They ask 4 key questions about life satisfaction, anxiety, happiness and
worthwhileness, where people answer on a scale of 0 “not at all” to 10 “completely”.
The report is now updated on a quarterly basis, rather than annually.
● In 2012-2016, life satisfaction, happiness and worthwhile have continued to rise whilst
anxiety levels fell but have begun to rise slightly. This could be as unemployment is
falling/GDP is rising but concerns over global security could be causing anxiety.
Relationship between real income and subjective happiness:
Studies show that the relationship between income and happiness is not always
straightforward. More income does not always mean more happiness.
- The Easterlin paradox:
Higher income increases happiness when incomes are very low, but not when they’re
already high.
1. Within a society, richer individuals are happier
2. Richer societies are not happier than poor ones
3. As countries get richer they don't get happier
Because it is the relative income that matters to happiness, not absolute
income.
Other studies have suggested that relative income can be important when
determining happiness.
Those with an income higher than average may be happier than those with below
average income because of its effect on their ability to demonstrate success and status.
- Other studies show that people in countries where there is less inequality are happier
than those in countries with large inequality.
2. 1. Measures of economic performance
2. 1. 1. Economic growth
a. Economic growth: an increase in the productive potential of an economy over a period
of time.
- It can be measured in the rate of change of real Gross Domestic Product (GDP).
- GDP: the total value of all goods and services produced within a country in a given
period of time.
- GDP is usually measured at market prices, meaning that the value of the goods includes
indirect taxes, but does not include the value of subsidies producers may receive.
- Taxes on goods increase market prices without changing output.
- Subsidies reduce prices.
- A more accurate measure of GDP is at factor cost, which subtracts taxes and adds
subsidies.
- Called Gross Value Added
, b.
Nominal vs. real Total vs. per capita Value vs. volume
Nominal GDP: the market Total GDP: the total amount Value: calculating the value
value of goods and services of output for the whole (billion pounds) of all the
produced in an economy, country goods and services produced
in one year
unadjusted for inflation.
Real: nominal GDP adjusted Per capita: total GDP divided Volume: adding up the
for inflation to reflect the real by the population quantity of goods and
changes. services produced in one
year.
c. Gross National Income (GNI) and Gross National Product (GNP)
- GNI: GDP + net income paid into the country by other countries
- This means that it adds what a country earns from overseas investments and
subtracts what foreigners earn in a country and send back home from the GDP.
- The net figure for property income could be negative or positive depending on
whether or not a country’s overseas earnings are greater, or smaller than the
earnings of foreign-owned businesses in the country.
- Poorer countries are likely to have a negative net property income as they often
have large investments from TNCs that are attracted by the cheap labour and
low regulation.
- GNP: GDP + income that residents receive from abroad - income claimed by non-
residents
- This means it is the value of all the goods produced by citizens of a country,
whether they live in the country or not.
- Whilst GDP is the value of all goods produced inside the country, whether they
were produced by citizens of the country or not.
d. Comparisons of the rate of growth between countries over time
Over time: changing national incomes will show whether a country has grown or shrunk over a
period of time.
- Data is compared to other countries and put in context. Can be compared to similar
countries to see if it has done well or not.
- The figures also make judgements about economic welfare as growth in national
income means a rise in living standards as consumers have more options.
Between countries: countries have different populations.
- A higher GDP does not necessarily mean better living standards if there is also a higher
population.
, - One must use real, per capita figures. If a country’s population grows over time, then
this may cause a rise in GDP without a rise in living standards and so provide inaccurate
comparisons. We use real GDP to strip out the effect of inflation.
e. Understanding Purchasing Power Parities (PPPs) and the use of PPP adjusted figures in
international comparisons
The market exchange rate might not reflect the purchasing power of a currency compared to
another.
PPPs show how much a basket of goods from one country (in one currency) would cost in a
different country (in a different currency).
- For example, £1 compared to $1.
A Big Mac might be £1 in London but $3 in NY.
This happens with most goods. The Purchasing Power Parity (PPP) rate of exchange is £1 = $3,
meaning that the value of UK GDP in dollars is $6000 billion, not $4000 billion.
In the real world market, exchange rates fluctuate for many reasons and can diverge from PPP
rates. In general, the PPP rates of exchange in developing countries are much higher than
market rates, as prices of goods and services are much lower than in richer countries.
f. The limitations of GDP to compare living standards between countries over time
There are some difficulties when comparing national income figures for a country over some
years:
1. Population change: per capita income is important for comparing living standards
2. Changing distribution of income: can change over time, but is not reflected in per
capita figures
3. Externalities: may increase or decrease, but they are not captured in GDP data
4. Changes in the quality of goods and services: GDP does not capture changes in
quality.
5. Changes in price: important to compare GDP data from different years in terms of
constant prices, not current prices
6. Changes in the size of the shadow economy: the shadow economy gets bigger in a
recession as people lose their jobs and work in the informal economy instead
7. Home produced goods/services: GDP is underestimated
8. Changes in government spending: changing priorities may result in big changes in
where money is spent
9. Changes in investment and consumption: living standards will improve in the short
term if households save less and spend more, but it will harm living standards in the
future
10. Errors in the calculation of inflation: GDP will be inaccurate.
, g. National happiness
UK wellbeing Programme:
● In 2010, the UK Prime Minister launched the Measuring National Wellbeing report to
measure how lives are improving. They found that self-reported health, relationship
status and employment status most affect personal well-being.
● They ask 4 key questions about life satisfaction, anxiety, happiness and
worthwhileness, where people answer on a scale of 0 “not at all” to 10 “completely”.
The report is now updated on a quarterly basis, rather than annually.
● In 2012-2016, life satisfaction, happiness and worthwhile have continued to rise whilst
anxiety levels fell but have begun to rise slightly. This could be as unemployment is
falling/GDP is rising but concerns over global security could be causing anxiety.
Relationship between real income and subjective happiness:
Studies show that the relationship between income and happiness is not always
straightforward. More income does not always mean more happiness.
- The Easterlin paradox:
Higher income increases happiness when incomes are very low, but not when they’re
already high.
1. Within a society, richer individuals are happier
2. Richer societies are not happier than poor ones
3. As countries get richer they don't get happier
Because it is the relative income that matters to happiness, not absolute
income.
Other studies have suggested that relative income can be important when
determining happiness.
Those with an income higher than average may be happier than those with below
average income because of its effect on their ability to demonstrate success and status.
- Other studies show that people in countries where there is less inequality are happier
than those in countries with large inequality.