1
Economics
Week 5
Chapter 26. GDP and the Measurement of Progress
Gross domestic product (GDP) is the market value of all final goods and services
produced within a country in a year. GDP per capita is GDP divided by a
country’s population.
26.1 What is GDP?
GDP measures an economy’s total output, which includes millions of different goods
and services. To measure total output it doesn’t make sense to simply add up
quantities. Instead, GDP uses market values to determine how much each good or
service is worth and then sums the total.
What is ‘final’? Some goods and services are sold to firms and then bundled or
processed with other goods or services for sale at a later stage. These are called
intermediate goods and services. We distinguish these from final goods and services,
which are sold to final users and then consumed or held in personal inventories. A
computer chip is one example of an intermediate good. We do, however, count the
production of machinery and equipment used to produce other goods as part of GDP. A
tractor, for example, may help to produce soybeans, but the tractor is not part of the
final product of soybeans. Thus, both tractor production and soybean production add to
GDP, even though the computer chip does not.
The output of an economy includes both goods and services.
,Services provide a benefit to individuals without the production of tangible output.
GDP is meant to measure production so sales of used goods are not included
in GDP. The sale of a used car, for example, is not included in GDP.
The GDP is the market value of the goods and services produced by labour and
capital located in a country, regardless of the nationality of the workers of the
property owners.
Gross national product (GNP) is the market value of all final goods and services
produced by a country’s permanent residents, wherever located, in a year.
26.2 Growth Rates
The growth rate of GDP tells us how rapidly the country’s production is rising or falling
over time. To compute the growth rate of GDP from 2012 to 2013 you need only two
numbers: GDP at the end of 2012 and at the end of 2013. Compute the percentage
change as:
26.3 Nominal vs. Real GDP
The rate of growth just calculated did not adjust for price changes and is called the
“nominal growth rate.” The alternative concept is the growth rate of real GDP and here is
the background for understanding that distinction. Nominal GDP is calculated using
prices at the time of sale. Economists usually are more interested in increases in
production than increases in prices because only increases in production are true
increases in the standard of living. But how can we measure increases in production
while controlling for increases in prices? Here is what we know so far:
● 2013 nominal GDP = 2013 prices x 2013 quantities = $16.8 trillion
● 2000 nominal GDP = 2000 prices x 2000 quantities = $10.3 trillion
Suppose we calculate GDP in 2000 using 2013 prices instead of 2000 prices. Now we
find:
● 2013 GDP in 2013 dollars = 2013 prices x 2013 quantities x $16.8 trillion
● 2000 GDP in 2013 dollars = 2013 prices x 2000 quantities x $13.8 trillion
,This tells us that if prices in 2000 were the same as in 2013, then GDP in 2000 would
have been measured as 13,8 trillion. Economists also say that 2000 GDP in 2013 dollars
is real GDP in 2013 dollars. Since 2013 GDP is already in 2013 dollars, it’s also real GDP
in 2013 dollars.
If we want to compare GDP over time, we should always compare real GDP, that
is, GDP calculated using the same prices in all years. Interestingly, it doesn’t matter
much what prices we use to calculate real GDP, so long as we use the same prices in all
years.
The GDP Deflator
The GDP Deflator is a price index that can be used to measure inflation. The GDP
Deflator is very easy to calculate once we know nominal and real GDP for a given year.
The GDP deflator is simply the ratio of nominal to real GDP (multiplied by 100):
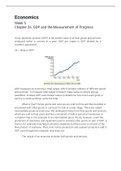
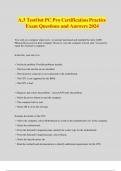
Real GDP Growth
Economists prefer the real GDP as the best indicator of current economic performance.
The figure shows the annual percentage changes in real GDP for the United States
from 1948 to 2013.
Real GDP Growth per Capital
Growth in real GDP per capita is usually the best reflection of changing living standards.
Growth in real GDP typically gives the same broad idea of how economic conditions are
changing as growth in real GDP per capita, but there can be big differences for
countries with rapidly growing populations.
, 26.4 Cyclical and Short–Run Changes in GDP
GDP is also used to measure short run fluctuations in an economy, namely the ups and
downs in economic growth that occur within the space of a few years.
A recession is a significant decline in economic activity spread across the
economy, lasting more than a few months, normally visible in real GDP, real income,
employment, industrial production, and wholesale-retail sales.
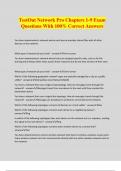
The figure plots real GDP growth and official U.S. recessions since 1948–this
time using quarterly data (expressed as annualized rates) so we can better see the
variability over time. There have been 11 recessions since 1948, indicated by the
shaded bars.
We call the fluctuations of real GDP around its long-term trend, or “normal”
growth rate, business fluctuations or business cycles. Business fluctuations or business
cycles are the short run movements in real GDP around its long-term trend. Defining
when a recession begins and ends is not always obvious, in part because economic
data are often revised over time.
26.5 The Many Ways of Splitting GDP
Another way of understanding GDP is to study its components and how they fit
together. Economists split the production of goods and services in many different ways
depending on the questions they are asking. We present two common ways of splitting
GDP:
1. National spending approach to GDP: Y = C + I + G + NX
Economists have found it useful, especially for the analysis of short-run economic
fluctuations, to split GDP into consumption (C), investment (I), government purchases
Economics
Week 5
Chapter 26. GDP and the Measurement of Progress
Gross domestic product (GDP) is the market value of all final goods and services
produced within a country in a year. GDP per capita is GDP divided by a
country’s population.
26.1 What is GDP?
GDP measures an economy’s total output, which includes millions of different goods
and services. To measure total output it doesn’t make sense to simply add up
quantities. Instead, GDP uses market values to determine how much each good or
service is worth and then sums the total.
What is ‘final’? Some goods and services are sold to firms and then bundled or
processed with other goods or services for sale at a later stage. These are called
intermediate goods and services. We distinguish these from final goods and services,
which are sold to final users and then consumed or held in personal inventories. A
computer chip is one example of an intermediate good. We do, however, count the
production of machinery and equipment used to produce other goods as part of GDP. A
tractor, for example, may help to produce soybeans, but the tractor is not part of the
final product of soybeans. Thus, both tractor production and soybean production add to
GDP, even though the computer chip does not.
The output of an economy includes both goods and services.
,Services provide a benefit to individuals without the production of tangible output.
GDP is meant to measure production so sales of used goods are not included
in GDP. The sale of a used car, for example, is not included in GDP.
The GDP is the market value of the goods and services produced by labour and
capital located in a country, regardless of the nationality of the workers of the
property owners.
Gross national product (GNP) is the market value of all final goods and services
produced by a country’s permanent residents, wherever located, in a year.
26.2 Growth Rates
The growth rate of GDP tells us how rapidly the country’s production is rising or falling
over time. To compute the growth rate of GDP from 2012 to 2013 you need only two
numbers: GDP at the end of 2012 and at the end of 2013. Compute the percentage
change as:
26.3 Nominal vs. Real GDP
The rate of growth just calculated did not adjust for price changes and is called the
“nominal growth rate.” The alternative concept is the growth rate of real GDP and here is
the background for understanding that distinction. Nominal GDP is calculated using
prices at the time of sale. Economists usually are more interested in increases in
production than increases in prices because only increases in production are true
increases in the standard of living. But how can we measure increases in production
while controlling for increases in prices? Here is what we know so far:
● 2013 nominal GDP = 2013 prices x 2013 quantities = $16.8 trillion
● 2000 nominal GDP = 2000 prices x 2000 quantities = $10.3 trillion
Suppose we calculate GDP in 2000 using 2013 prices instead of 2000 prices. Now we
find:
● 2013 GDP in 2013 dollars = 2013 prices x 2013 quantities x $16.8 trillion
● 2000 GDP in 2013 dollars = 2013 prices x 2000 quantities x $13.8 trillion
,This tells us that if prices in 2000 were the same as in 2013, then GDP in 2000 would
have been measured as 13,8 trillion. Economists also say that 2000 GDP in 2013 dollars
is real GDP in 2013 dollars. Since 2013 GDP is already in 2013 dollars, it’s also real GDP
in 2013 dollars.
If we want to compare GDP over time, we should always compare real GDP, that
is, GDP calculated using the same prices in all years. Interestingly, it doesn’t matter
much what prices we use to calculate real GDP, so long as we use the same prices in all
years.
The GDP Deflator
The GDP Deflator is a price index that can be used to measure inflation. The GDP
Deflator is very easy to calculate once we know nominal and real GDP for a given year.
The GDP deflator is simply the ratio of nominal to real GDP (multiplied by 100):
Real GDP Growth
Economists prefer the real GDP as the best indicator of current economic performance.
The figure shows the annual percentage changes in real GDP for the United States
from 1948 to 2013.
Real GDP Growth per Capital
Growth in real GDP per capita is usually the best reflection of changing living standards.
Growth in real GDP typically gives the same broad idea of how economic conditions are
changing as growth in real GDP per capita, but there can be big differences for
countries with rapidly growing populations.
, 26.4 Cyclical and Short–Run Changes in GDP
GDP is also used to measure short run fluctuations in an economy, namely the ups and
downs in economic growth that occur within the space of a few years.
A recession is a significant decline in economic activity spread across the
economy, lasting more than a few months, normally visible in real GDP, real income,
employment, industrial production, and wholesale-retail sales.
The figure plots real GDP growth and official U.S. recessions since 1948–this
time using quarterly data (expressed as annualized rates) so we can better see the
variability over time. There have been 11 recessions since 1948, indicated by the
shaded bars.
We call the fluctuations of real GDP around its long-term trend, or “normal”
growth rate, business fluctuations or business cycles. Business fluctuations or business
cycles are the short run movements in real GDP around its long-term trend. Defining
when a recession begins and ends is not always obvious, in part because economic
data are often revised over time.
26.5 The Many Ways of Splitting GDP
Another way of understanding GDP is to study its components and how they fit
together. Economists split the production of goods and services in many different ways
depending on the questions they are asking. We present two common ways of splitting
GDP:
1. National spending approach to GDP: Y = C + I + G + NX
Economists have found it useful, especially for the analysis of short-run economic
fluctuations, to split GDP into consumption (C), investment (I), government purchases