Marginal Cost - the cost of making an extra unit of output
Marginal Benefit - the extra benefit obtained from some activity
Marginal Revenue - the extra revenue earned by a firm for selling one more unit of output
Opportunity Cost - The value of what a producer gives up by using an input
Utility - The act of deriving a benefit from the consumption of goods and services.
Optimal Choice - where the benefit from consuming the last unit of a good is the same as the cost of consuming that unit, marginal benefit = marginal cost
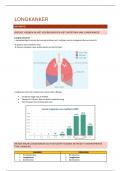
The Marginal Benefit and Marginal Cost Graph
- As we consume more of something presumably we obtain more benefit from it. However, obtaining more might cost us more.
- The extra benefit we obtained is defined as the marginal benefit.
- The extra cost is defined as the marginal cost.
- The goal is the optimal choice, and this is where the benefit from consuming the last unit of a good is the same as the cost of consuming it, meaning the
marginal benefit is equal to the marginal cost.
The Supply and Demand Model
- Demand represents the consumers demanding a good
- Supply represents the producers producing a good
- Assumptions:
- Many identical buyers and sellers
- No barriers for new firms entering the market
- Known market price
- The exogenous variables (inputs) are the demand curve and the supply curve
- The endogenous variables are the market price and the quantity of the goods exchanged.
, The Demand Curve
- The demand curve equation: sloping downwards shows the relationship between quantity demanded and price holding all other factors constant.
- It’s linear equation shows that the amount demanded will be some function of the price
- The inverse or implicitly demand curve is:
-
-
The Supply Curve
Marginal Benefit - the extra benefit obtained from some activity
Marginal Revenue - the extra revenue earned by a firm for selling one more unit of output
Opportunity Cost - The value of what a producer gives up by using an input
Utility - The act of deriving a benefit from the consumption of goods and services.
Optimal Choice - where the benefit from consuming the last unit of a good is the same as the cost of consuming that unit, marginal benefit = marginal cost
The Marginal Benefit and Marginal Cost Graph
- As we consume more of something presumably we obtain more benefit from it. However, obtaining more might cost us more.
- The extra benefit we obtained is defined as the marginal benefit.
- The extra cost is defined as the marginal cost.
- The goal is the optimal choice, and this is where the benefit from consuming the last unit of a good is the same as the cost of consuming it, meaning the
marginal benefit is equal to the marginal cost.
The Supply and Demand Model
- Demand represents the consumers demanding a good
- Supply represents the producers producing a good
- Assumptions:
- Many identical buyers and sellers
- No barriers for new firms entering the market
- Known market price
- The exogenous variables (inputs) are the demand curve and the supply curve
- The endogenous variables are the market price and the quantity of the goods exchanged.
, The Demand Curve
- The demand curve equation: sloping downwards shows the relationship between quantity demanded and price holding all other factors constant.
- It’s linear equation shows that the amount demanded will be some function of the price
- The inverse or implicitly demand curve is:
-
-
The Supply Curve