Production Possibility Frontier (PPF’s)
A PPF shows the maximum potential level of output for two goods or
services that an economy can achieve when all its resources are fully
and efficiently employed
We use the ceteris paribus rule which means we will explore this
relationship without considering changes in other variables
Movement along the PPF
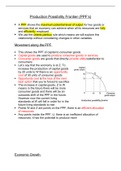
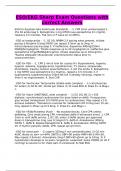
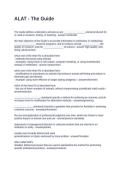
This shows the PPF of capital to consumer goods
Capital goods are used to produce consumer goods or services
Consumer goods are goods that directly provide utility/satisfaction to
consumers
Let’s say that the economy is at Z. To
increase the production of capital goods
by 20 units to W there is an opportunity
cost of 30 units of consumer goods
Opportunity cost is the loss of the next
best option that you’re forced to sacrifice
The increase in capital goods, Z to W
means in the future there will be more
consumer goods and there will be an
outwards shift of the PPF in the future.
However now the current living
standards at W will fall in order for in the
future living standards to rise
Points W and Z are points on the PPF, there is an efficient allocation
of resources
Any points inside the PPF, U, there is an inefficient allocation of
resources, it has the potential to produce more
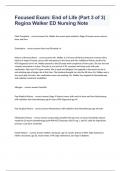
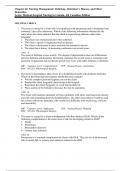
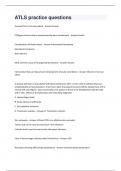
Economic Growth
, This shows a shift outwards in the PPF, the
country’s production potential may increase
over time. This can be due to a number of
possible causes: an increase in the factors of
production
1. Capital investment
2. Technological innovation
3. Increased labour force – immigration
4. More skilled labour force through better
training/education
Occasionally the PPF can shifts inwards and
the production potential has decreased, the
economy can’t produce as much as it used to
This can be caused by:
1. Less of the factors of production (less
labour, land and capital)
2. War
3. People leaving the country due to war
4. Natural disasters including wildfires,
earthquakes, volcanoes, etc
Sometimes it is possible for the potential
productivity of one variable / one sector of the
economy to increase – this is called asymmetric
growth, the PPF has been stretched in only the
horizontal direction
How markets work?
, A market is a situation where goods and services are bought and
sold. There’s a demand from buyers and supply from sellers
Some examples are:
1. Fish market
2. Ebay
3. Product market – refers to consumers buying goods and
services which the consumer derives utility from – chocolate
Utility is satisfaction from consuming a product and the price
consumers are willing to pay for that product
Consumers are assumed to make rational decisions (where
consumers allocate their expenditure on goods and services to
maximise utility and producers allocate their resources to maximise
profits)
Firms are considered rational to maximise profits
The price charged for and quantity sold of each good/service are
determined by the levels of demand and supply in a market
Demand is wanting a good/service plus the ability to pay
Price mechanism – automatic determination of prices and allocation
of scarce resources by the operating markets in the economy
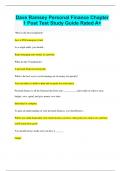
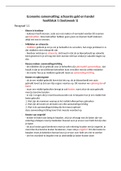
A demand curve shows the inverse relationship between price and
quantity demanded. As price increases
demand decreases and vice-versa
The demand curve is a downward slope
from left to right because, as price falls, the
good becomes cheaper compared to
substitute goods plus more can be
purchased with a given level of income, so
demand increases
These two reasons for the demand curve
sloping downwards are:
1. Substitution effect – when the price
of a good falls, it becomes cheaper relative to its substitutes, so
consumers will increase demand for the cheaper good and
reduce demand for the more expensive substitutes
2. Income effect – the real income of consumers may rise when
the price of a good falls; consumers can buy more with their
income which increases demand too
Demand curves
A PPF shows the maximum potential level of output for two goods or
services that an economy can achieve when all its resources are fully
and efficiently employed
We use the ceteris paribus rule which means we will explore this
relationship without considering changes in other variables
Movement along the PPF
This shows the PPF of capital to consumer goods
Capital goods are used to produce consumer goods or services
Consumer goods are goods that directly provide utility/satisfaction to
consumers
Let’s say that the economy is at Z. To
increase the production of capital goods
by 20 units to W there is an opportunity
cost of 30 units of consumer goods
Opportunity cost is the loss of the next
best option that you’re forced to sacrifice
The increase in capital goods, Z to W
means in the future there will be more
consumer goods and there will be an
outwards shift of the PPF in the future.
However now the current living
standards at W will fall in order for in the
future living standards to rise
Points W and Z are points on the PPF, there is an efficient allocation
of resources
Any points inside the PPF, U, there is an inefficient allocation of
resources, it has the potential to produce more
Economic Growth
, This shows a shift outwards in the PPF, the
country’s production potential may increase
over time. This can be due to a number of
possible causes: an increase in the factors of
production
1. Capital investment
2. Technological innovation
3. Increased labour force – immigration
4. More skilled labour force through better
training/education
Occasionally the PPF can shifts inwards and
the production potential has decreased, the
economy can’t produce as much as it used to
This can be caused by:
1. Less of the factors of production (less
labour, land and capital)
2. War
3. People leaving the country due to war
4. Natural disasters including wildfires,
earthquakes, volcanoes, etc
Sometimes it is possible for the potential
productivity of one variable / one sector of the
economy to increase – this is called asymmetric
growth, the PPF has been stretched in only the
horizontal direction
How markets work?
, A market is a situation where goods and services are bought and
sold. There’s a demand from buyers and supply from sellers
Some examples are:
1. Fish market
2. Ebay
3. Product market – refers to consumers buying goods and
services which the consumer derives utility from – chocolate
Utility is satisfaction from consuming a product and the price
consumers are willing to pay for that product
Consumers are assumed to make rational decisions (where
consumers allocate their expenditure on goods and services to
maximise utility and producers allocate their resources to maximise
profits)
Firms are considered rational to maximise profits
The price charged for and quantity sold of each good/service are
determined by the levels of demand and supply in a market
Demand is wanting a good/service plus the ability to pay
Price mechanism – automatic determination of prices and allocation
of scarce resources by the operating markets in the economy
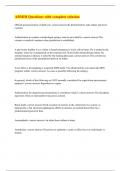
A demand curve shows the inverse relationship between price and
quantity demanded. As price increases
demand decreases and vice-versa
The demand curve is a downward slope
from left to right because, as price falls, the
good becomes cheaper compared to
substitute goods plus more can be
purchased with a given level of income, so
demand increases
These two reasons for the demand curve
sloping downwards are:
1. Substitution effect – when the price
of a good falls, it becomes cheaper relative to its substitutes, so
consumers will increase demand for the cheaper good and
reduce demand for the more expensive substitutes
2. Income effect – the real income of consumers may rise when
the price of a good falls; consumers can buy more with their
income which increases demand too
Demand curves