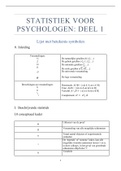
STATISTIEK VOOR
PSYCHOLOGEN: DEEL 1
Lijst met betekenis symbolen
0. Inleiding
Verzamelingen:
N De natuurlijke getallen (0,1,2,…)
Z De gehele getallen (-2,-1,1,2,…)
!
Q De rationale getallen (" , … )
R De reële getallen (√2, √6, … )
U De universele verzameling
ø De lege verzameling
Bewerkingen op verzamelingen: Doorsnede: A∩B = {x|x ∈ A en x ∈ B}
∩ Unie: A∪B = {x|x ∈ A en/of x ∈ B}
∪ Verschil: 𝐴 ∖ 𝐵 = { x| x ϵ A en x ∉ B}
∖
# Complement: 𝐴# = U∖𝐴
I. Beschrijvende statistiek
I.0 conceptueel kader
Uitkomst van de proef
ω
Verzameling van alle mogelijke uitkomsten
Ω
Totaal aantal objecten of experimentele
n
eenheden
De ‘lopende’ of ‘stomme’ index, kan alle
mogelijke waarden aannemen tussen 1 en n;
i
in deze colleges, in het geval van geordende
uitkomsten altijd letter ‘i’
Variabele
X
1
, I.1 Beschrijvende statistiek met 1 variabele
De mogelijke waarden van de variabele.
m
Index letters:
i van 1 tot n, waarbij x$ de i-de observatie
i voor de variabele X aanduidt
j van 1 tot m, waarbij x% de j-de waarde van
j
variabele X
Percentielen: x.(! , x.() , … , 𝑥&&
Pc! … Pc&&
Decielen: 𝑥.! , 𝑥.) , … , 𝑥.&
D! … D!(
Kwartielen: x.)+ 𝑥.+( 𝑥.-+
Q! Q ) Q *
Elke waarde x waarvoor freq (x) maximaal
Modus is.
Mediaan: Pc.+( = D.+ = Q )
Me.
Rekenkundig gemiddelde
𝑋>
Bereik
Max (X) – Min (X)
Interkwartielbereik
Q * − Q!
Variantie, is de gemiddelde kwadratische
afstand van de observaties t.o.v. hun
𝑠.)
gemiddelde.
Standaarddeviantie, is de variantie
uitgedrukt op de schaal van de
𝑠.
oorspronkelijke gegevens.
Z-getransformeerde scores worden kortweg
ook Z-scores of standaardscores genoemd.
Z(𝑥/ )
Deze zijn enkel gedefinieerd als 𝑠. ≠ 0.
Lineaire transformatie
f(x)= ax + b
2